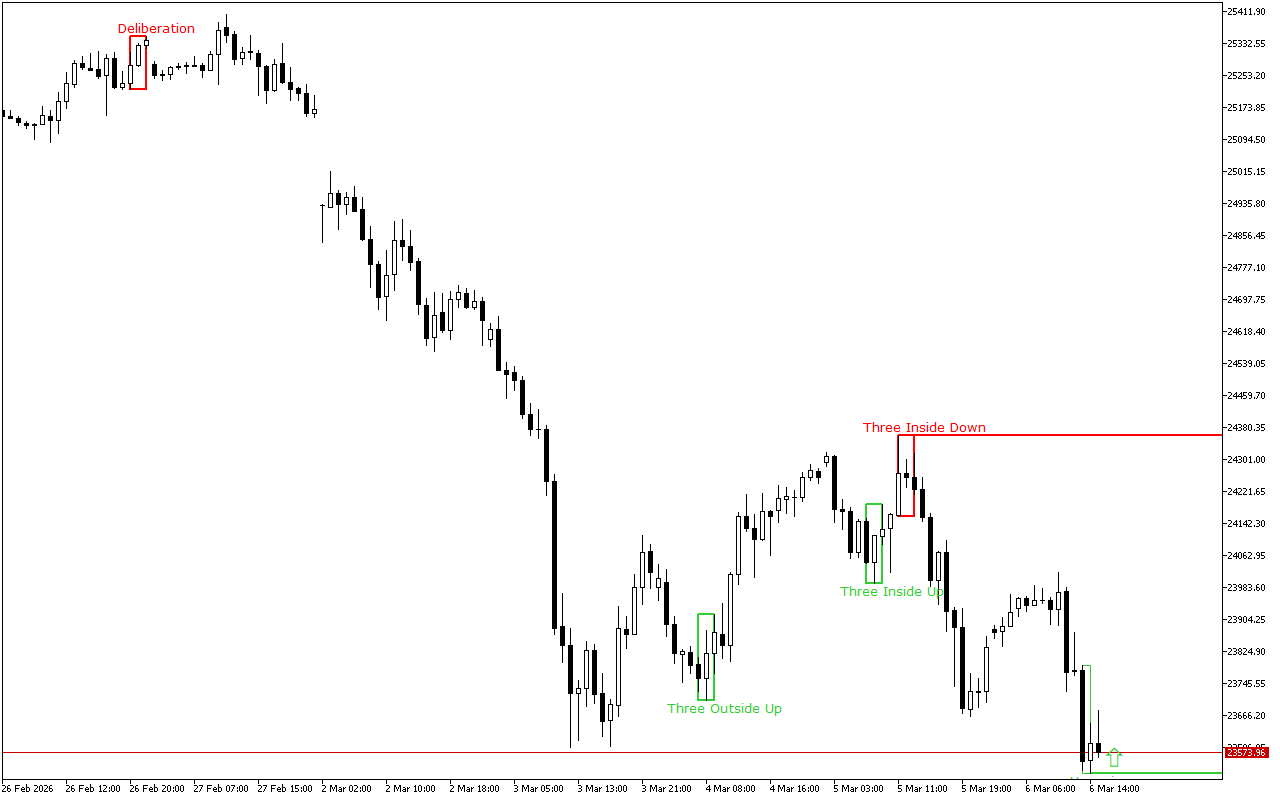
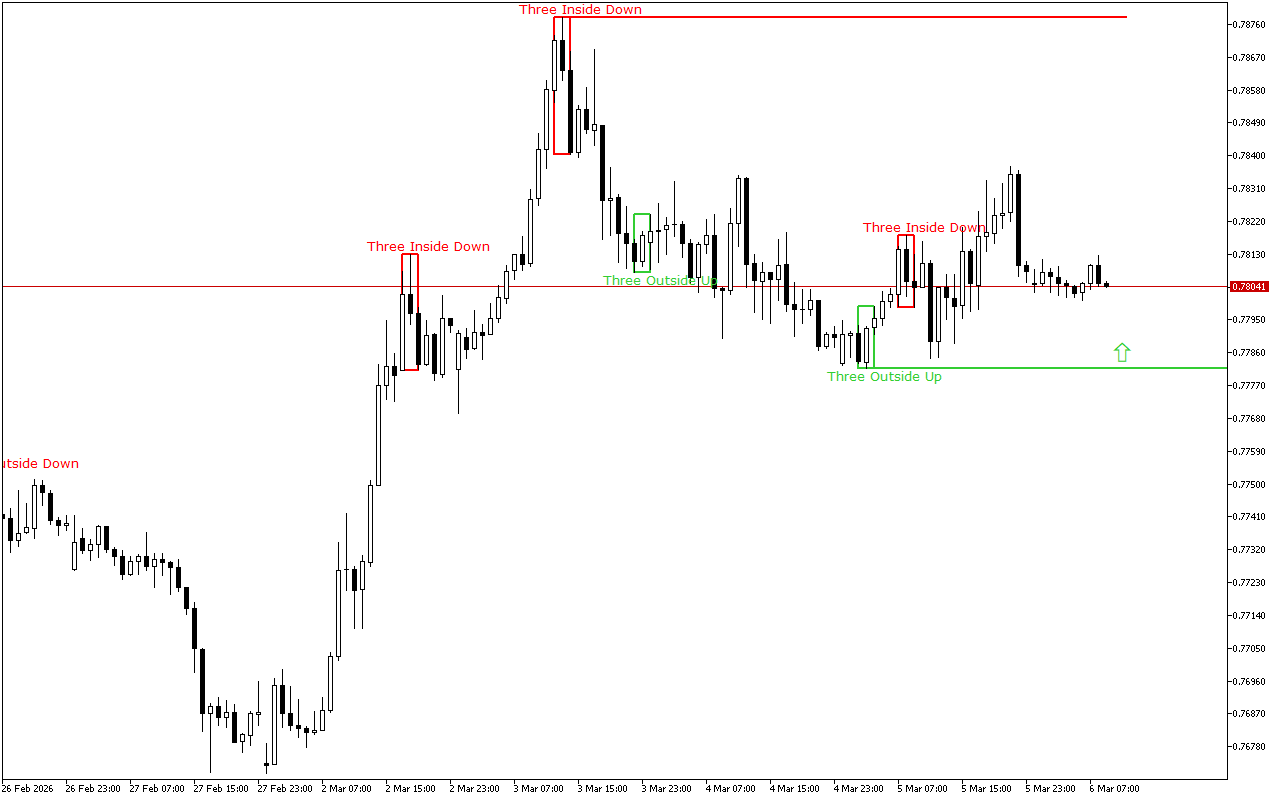
USDCHF closes the last trading session in the green zone, while the downward price movement vector prevails on the higher time-frame.
The support and resistance levels:
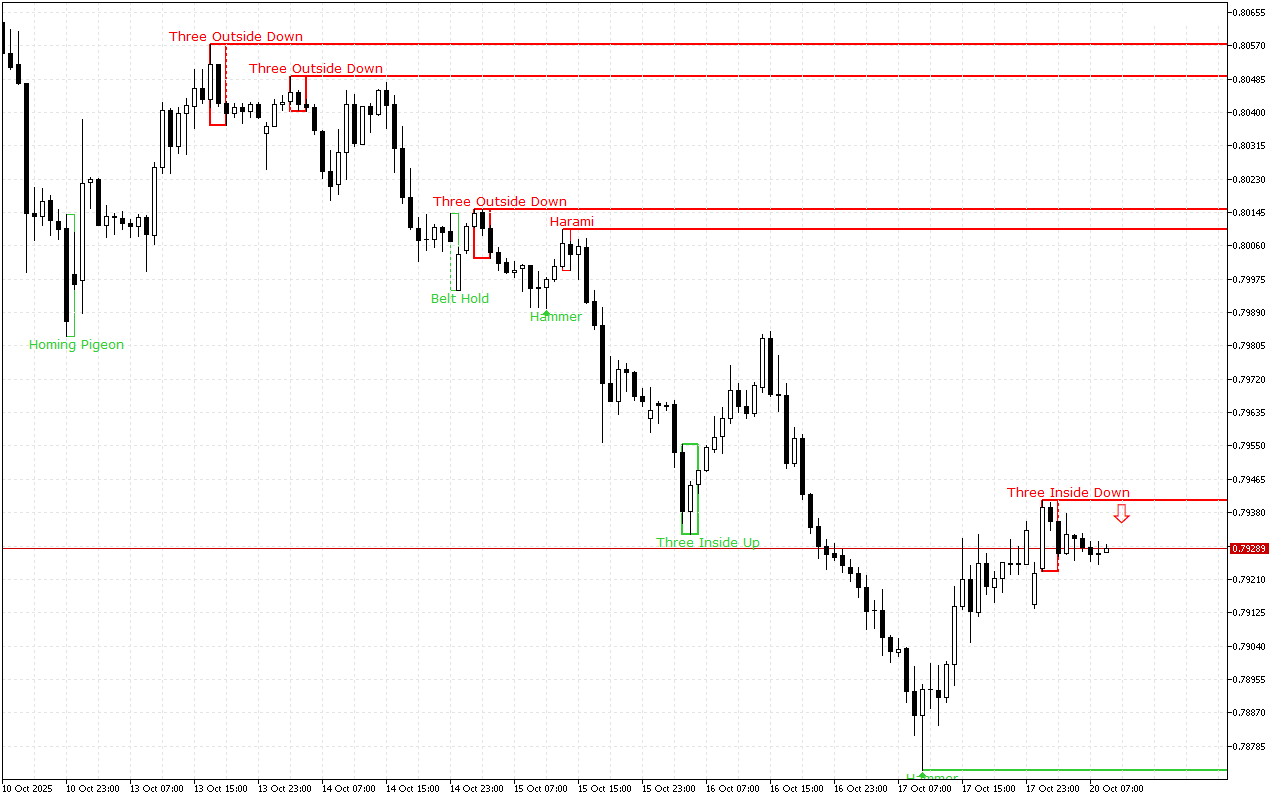
The nearest support level is at the price level of the 0.78722.
This level was formed by the Hammer pattern, also known as the Pin Bar pattern. This pattern is represented with a single Japanese candlestick which is composed of a small real body and a long lower shadow.
The nearest significant resistance level is at the 0.7941 mark.
This level was formed by the Three Inside Down pattern. This pattern consists of three Japanese candles: the first candle has a short black real body, the second candle also has a black real body and is completely inside the body of the first candle, and the third candle is also black and closes below the body of the second candle.
Trading recommendations:
The latest pattern formed on the chart prioritizes short positions. This signal is also proved with the price movement dynamics on the higher time-frame.
USDCHF H1: The Price Action Forecast for the European Session on 20.10.2025