During the previous trading session, USDCHF demonstrated downward dynamics. On a longer time-frame, the upward trend still prevails.
The support and resistance levels:
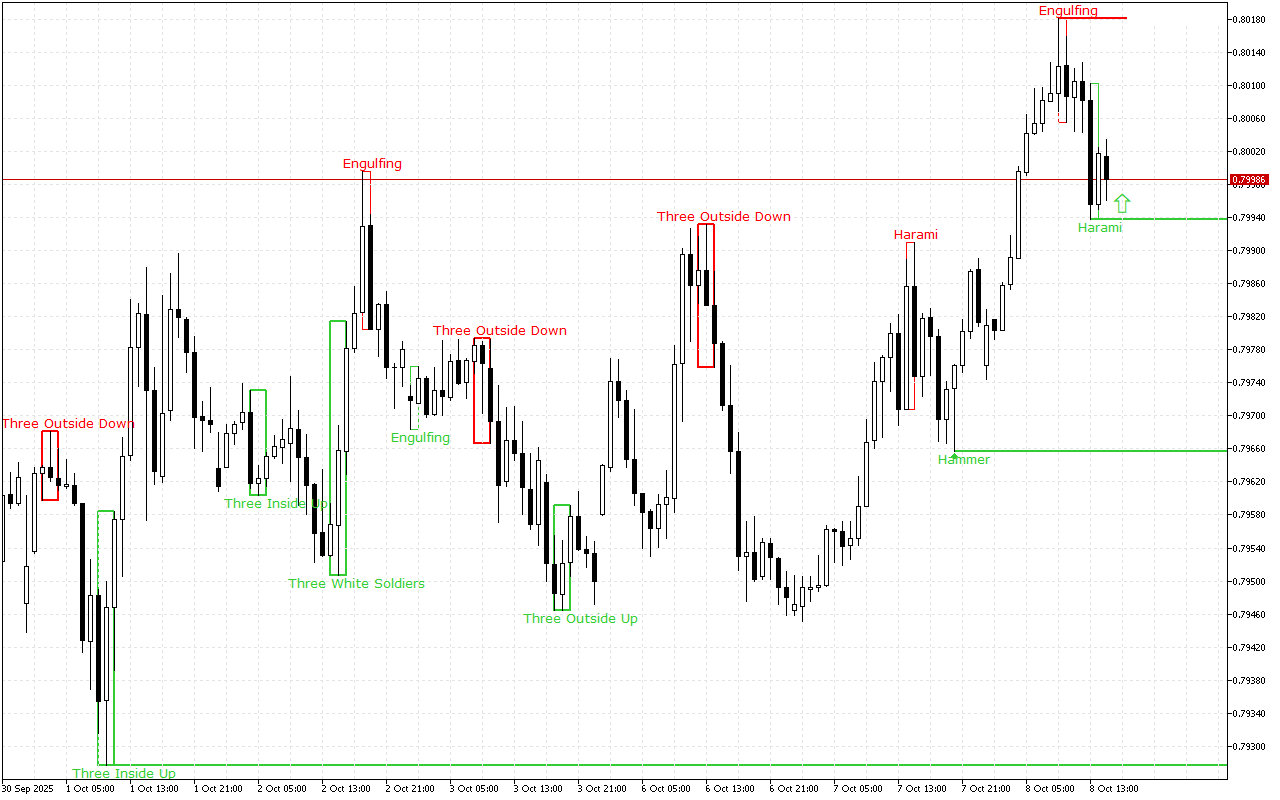
The nearest support level is at the price level of the 0.79938.
This level was formed by the Bullish Harami pattern. The pattern is represented with two Japanese candles, where the second one with a smaller real body is inside the body of the first one.
The nearest significant resistance level is at the 0.80181 mark.
The Bearish Engulfing pattern formed this level. It consists of two Japanese candles: the first candle is located inside the body of the second candle.
Trading recommendations:
On the higher time-frame, the upward price dynamics prevail. The last signal on the chart also indicates the upcoming growth. Against this background, it is worth prioritizing the buy signals during the day.
USDCHF H1: The Price Action Forecast for the American Session on 8.10.2025