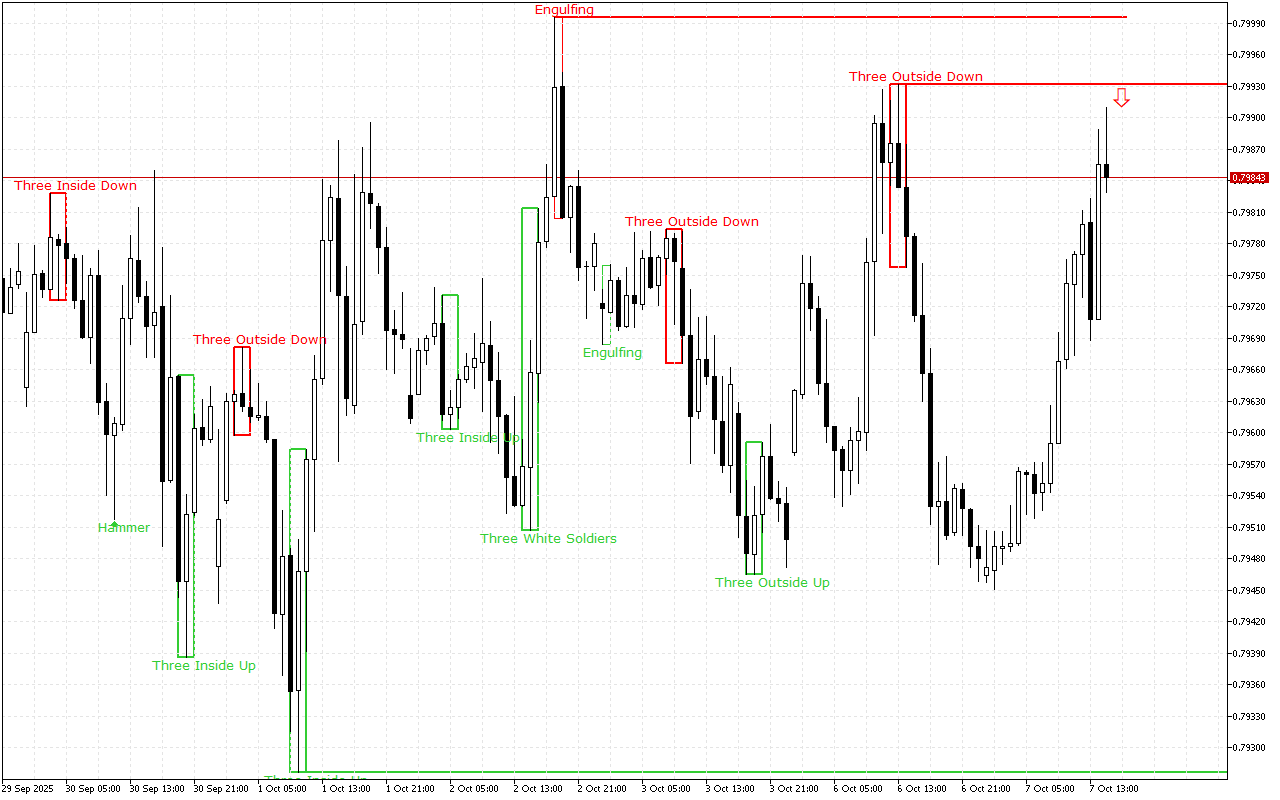
During the previous trading session, the positive dynamics of the USDCHF movement were seen. On a longer time-frame, the upward price movement vector also prevails.
The support and resistance levels:
The nearest support level is at the price level of the 0.79277.
The nearest significant resistance level is at the 0.79932 mark.
The pattern formed here is Three Outside Bars Down. This pattern is a combination of three Japanese candlesticks. The first candlestick has a short white real body, the second candlestick has a long black real body and completely engulfs the first candlestick, and the third candlestick is also black, closing below the second candlestick.
Trading recommendations:
The upward dynamics prevail on a longer time period, but the short positions should be prioritized during the day because the latest signal suggests a dominant downward movement.
USDCHF H1: The Price Action Forecast for the American Session on 7.10.2025