During the previous trading session, the price of Natural Gas decreased, moving in the main trend direction on the higher time-frame.
The support and resistance levels:
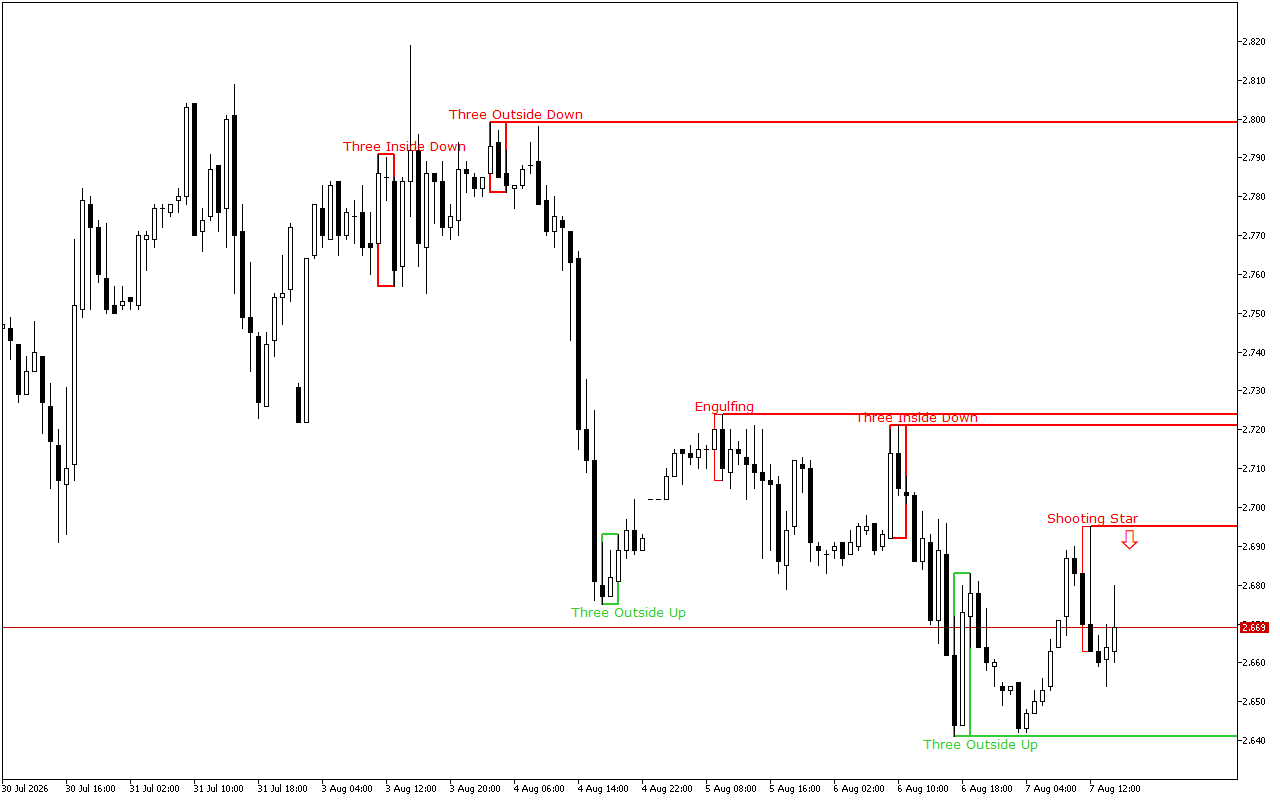
The nearest support level is at the price level of the 2.641.
This level was formed by the Three Outside Bars Up pattern. The pattern consists of three Japanese candlesticks: the first candlestick has a short black real body, the second candlestick has a long white real body and completely engulfs the first candlestick, and the third candlestick is also white, closing above the second candlestick.
The nearest significant resistance level is at the 2.695 mark.
The level was formed by the Shooting Star pattern. This pattern is a single candlestick which is composed of a small real body and a long upper shadow. This pattern is usually called “Pin Bar” by traders.
Trading recommendations:
During the day, it is worth considering the possibilities for opening short positions. This is indicated by both: the dynamics of price movement over a longer distance and the latest formed pattern.
Natural Gas H1: The Price Action Forecast for the American Session on 7.8.2026