Natural Gas closes the last trading session in the green zone, while the downward price movement vector prevails on the higher time-frame.
The support and resistance levels:
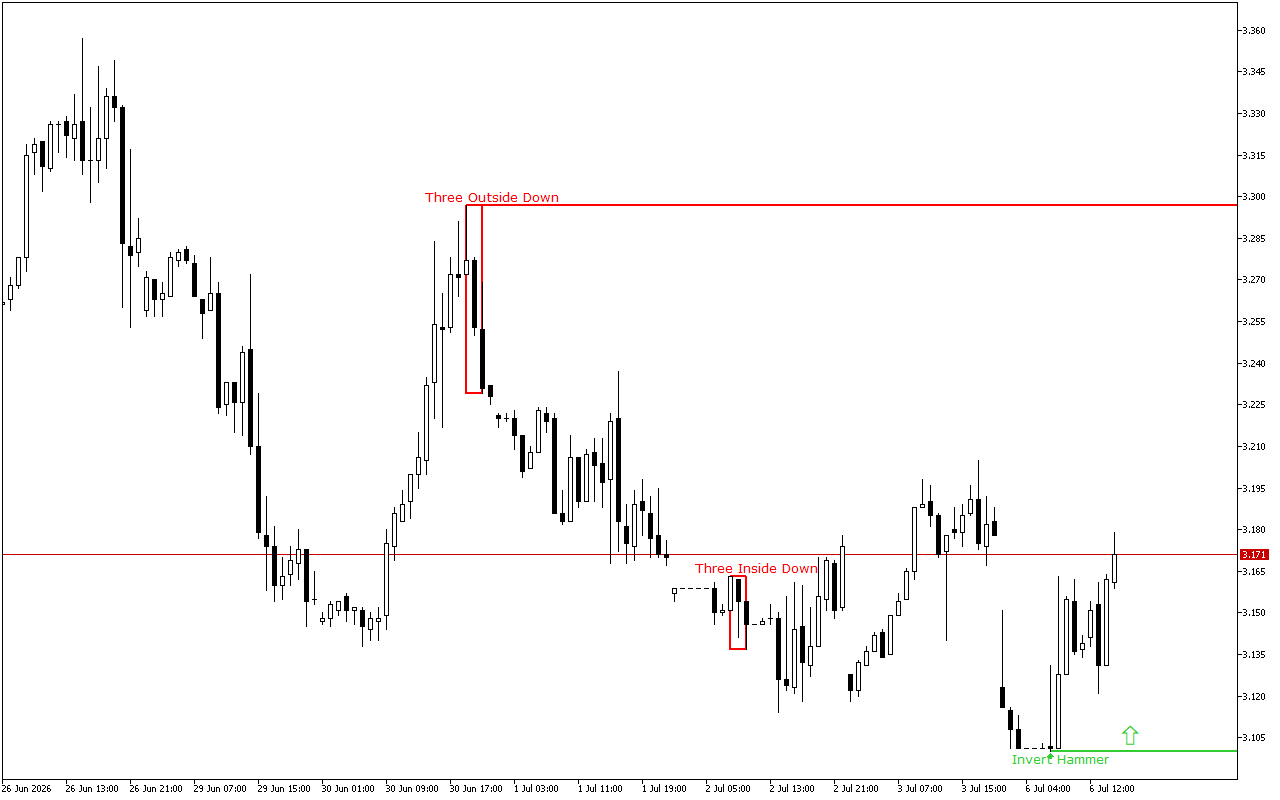
The nearest support level is at the price level of the 3.1.
The level was formed by the Inverted Hammer pattern. This pattern is represented with is a single Japanese candlestick composed of a small real body and a long upper shadow.
The nearest significant resistance level is at the 3.297 mark.
The pattern formed here is Three Outside Bars Down. This pattern is a combination of three Japanese candlesticks. The first candlestick has a short white real body, the second candlestick has a long black real body and completely engulfs the first candlestick, and the third candlestick is also black, closing below the second candlestick.
Trading recommendations:
The latest signal on the chart indicates the prevalence of the long positions. This signal is valid, until the other pattern is formed.
Natural Gas H1: The Price Action Forecast for the American Session on 6.7.2026