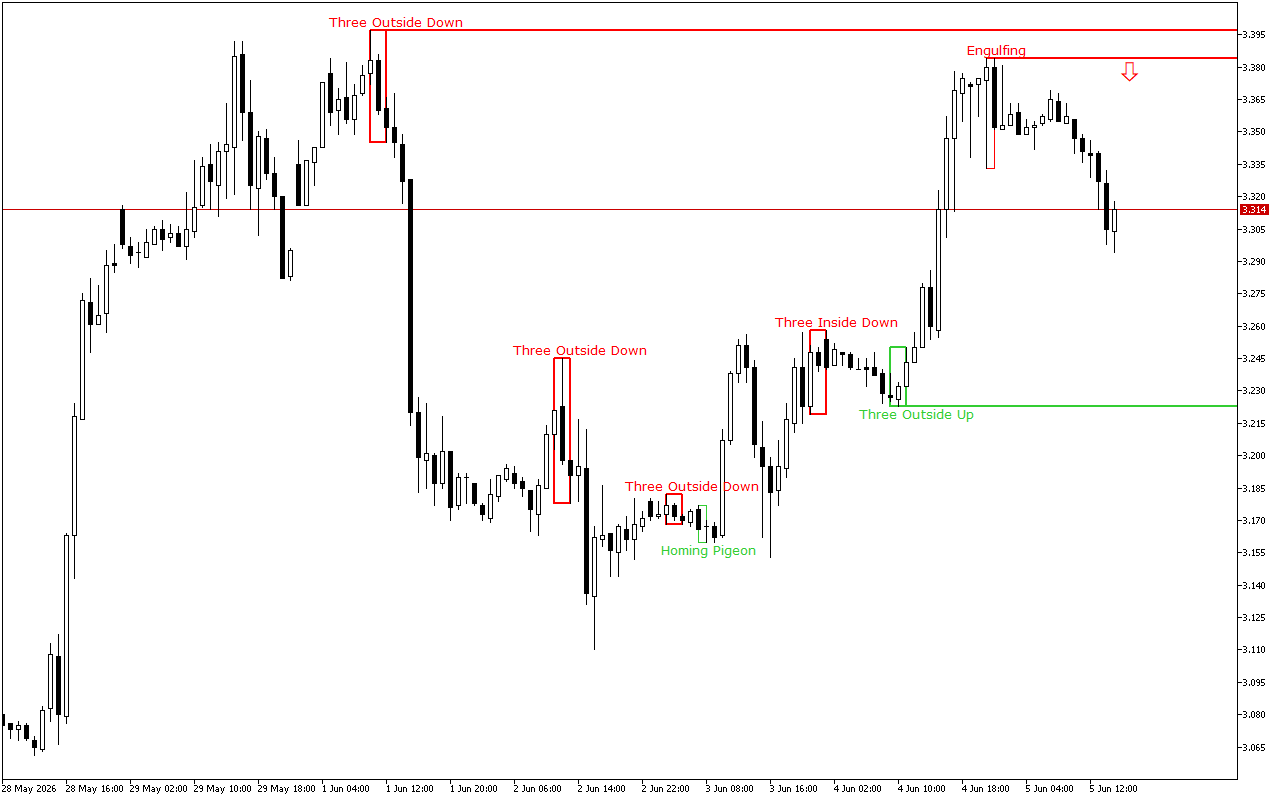
During the previous trading session, Natural Gas demonstrated downward dynamics. On a longer time-frame, the upward trend still prevails.
The support and resistance levels:
The nearest support is set at the 3.223 mark.
This level was formed by the Three Outside Bars Up pattern. The pattern consists of three Japanese candlesticks: the first candlestick has a short black real body, the second candlestick has a long white real body and completely engulfs the first candlestick, and the third candlestick is also white, closing above the second candlestick.
The nearest resistance is set at the 3.384 mark.
The Bearish Engulfing pattern formed this level. It consists of two Japanese candles: the first candle is located inside the body of the second candle.
Trading recommendations:
The latest signal prioritizes short positions intraday.
Natural Gas H1: The Price Action Forecast for the American Session on 5.6.2026