During the previous trading session, the price of Bit.Cash decreased, moving in the main trend direction on the higher time-frame.
The support and resistance levels:
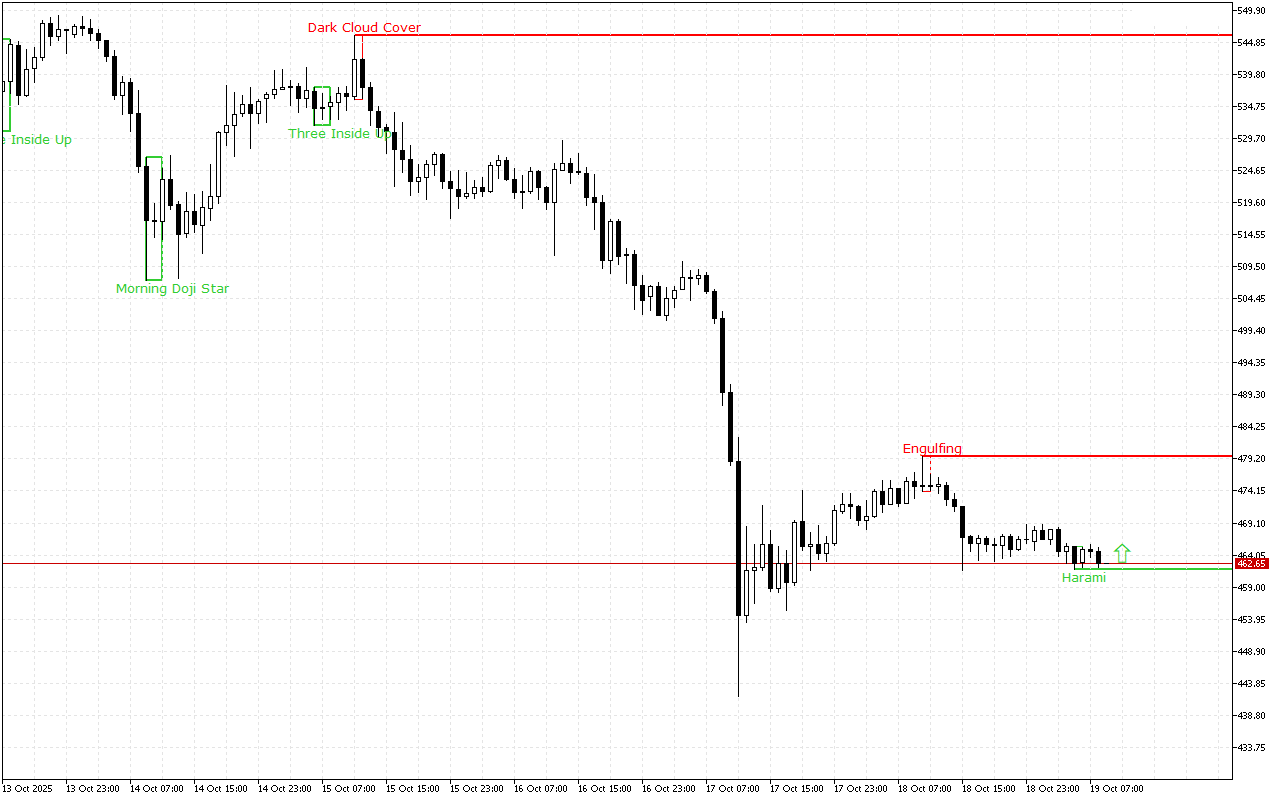
The current support level is in the area of the 461.77 mark.
This level was formed by the Bullish Harami pattern. The pattern is represented with two Japanese candles, where the second one with a smaller real body is inside the body of the first one.
The current resistance level is at the 479.55 mark.
The Bearish Engulfing pattern formed this level. It consists of two Japanese candles: the first candle is located inside the body of the second candle.
Trading recommendations:
The latest signal on the chart indicates the prevalence of the long positions. This signal is valid, until the other pattern is formed.
Bit.Cash H1: The Price Action Forecast for the European Session on 19.10.2025