Bit.Cash closes the last trading session in the green zone, while the downward price movement vector prevails on the higher time-frame.
The support and resistance levels:
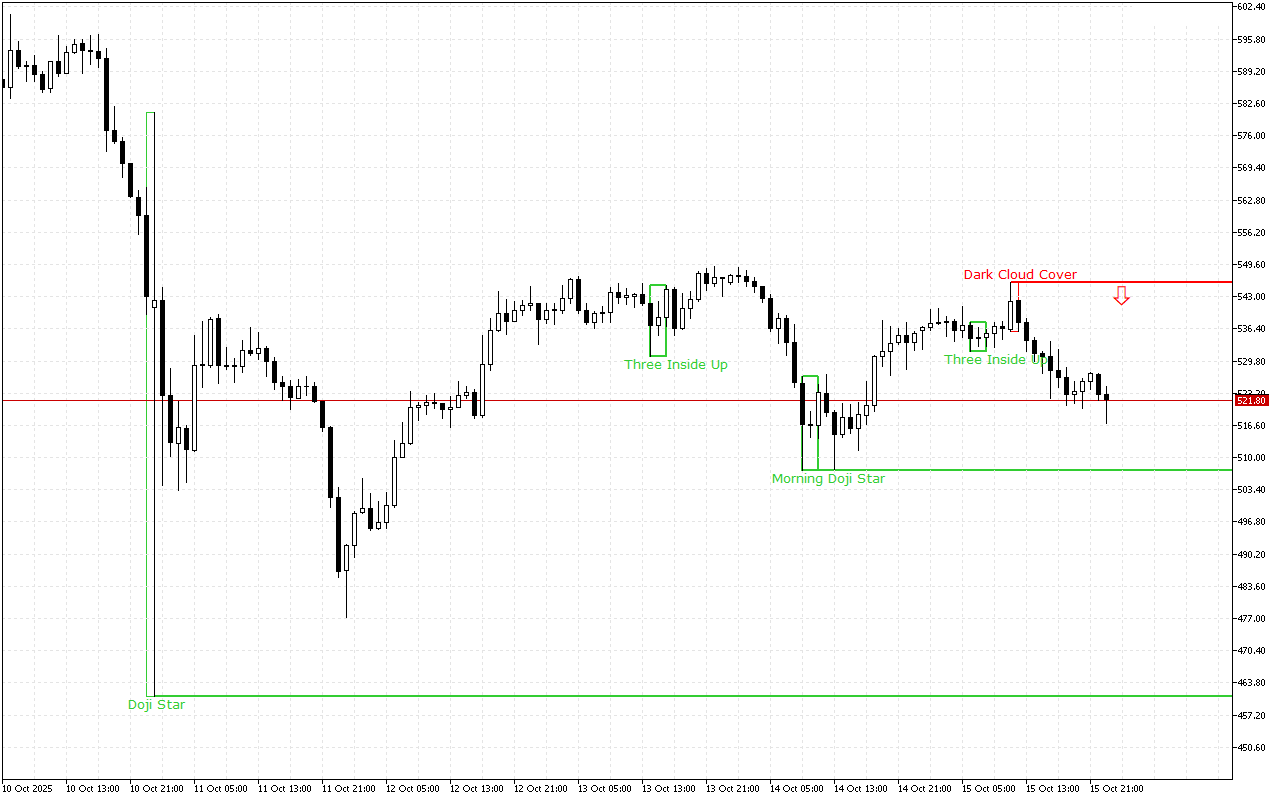
The nearest support is set at the 507.29 mark.
The Morning Doji Star pattern has formed here. This pattern consists of a combination of three Japanese candlesticks. The appearance of this pattern on the chart significantly increases the probability of a price reversal.
The nearest resistance is set at the 545.87 mark.
This level was formed by the Dark Cloud Cover pattern. The pattern consists of two candles: the first candle is long and white, and the second is black. The second one opens with a gap up and closes below the middle of the real body of the first candle.
Trading recommendations:
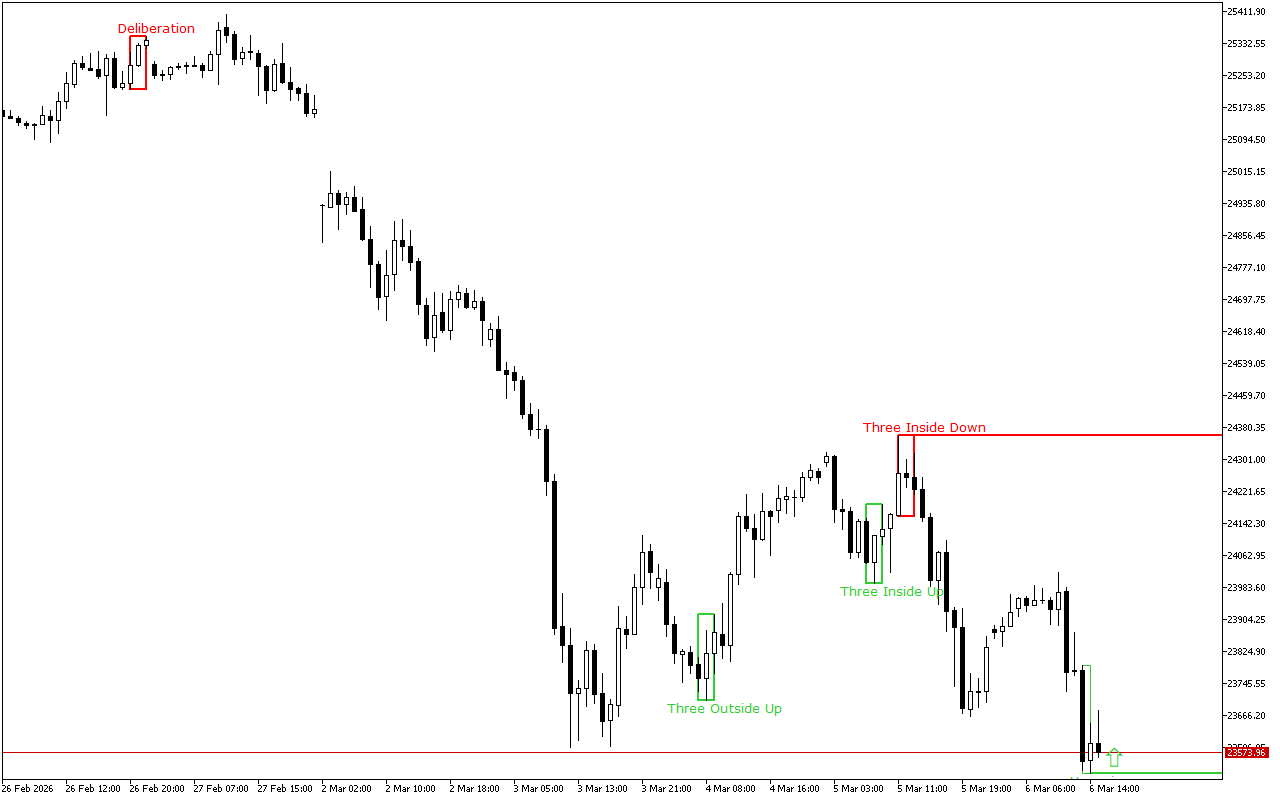
The latest pattern formed on the chart prioritizes short positions. This signal is also proved with the price movement dynamics on the higher time-frame.
Bit.Cash H1: The Price Action Forecast for the Asian Session at 16.10.2025