During the previous trading session, Bit.Cash demonstrated downward dynamics. On a longer time-frame, the upward trend still prevails.
The support and resistance levels:
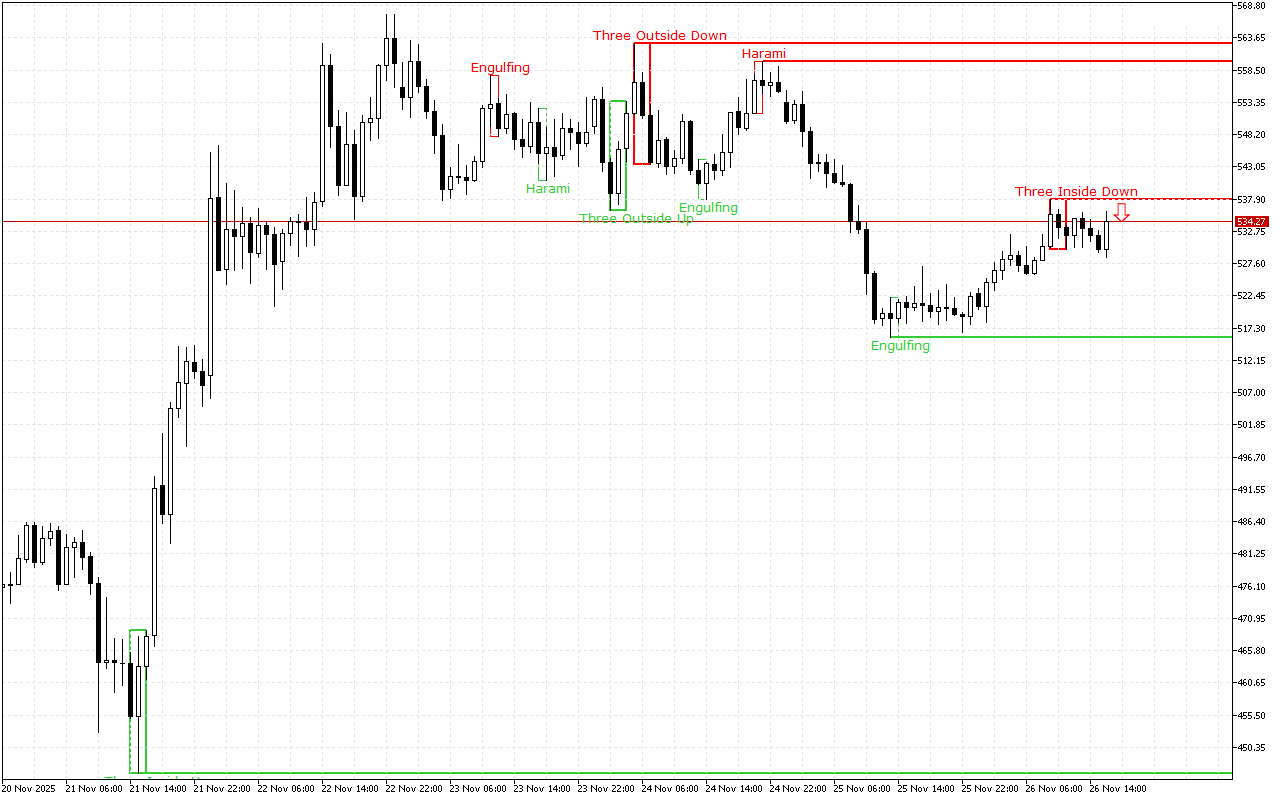
The closest support to the price is at the 515.74 mark.
This level was formed by the Bullish Engulfing pattern. The pattern consists of two candles: the first one is inside the body of the second one, which is much larger. The second candle completely engulfs the first one.
The nearest resistance level is at the level of the 537.81.
This level was formed by the Three Inside Down pattern. This pattern consists of three Japanese candles: the first candle has a short black real body, the second candle also has a black real body and is completely inside the body of the first candle, and the third candle is also black and closes below the body of the second candle.
Trading recommendations:
The latest signal prioritizes short positions intraday.
Bit.Cash H1: The Price Action Forecast for the American Session on 26.11.2025