During the previous trading session, USDCHF demonstrated downward dynamics. On a longer time-frame, the upward trend still prevails.
The support and resistance levels:
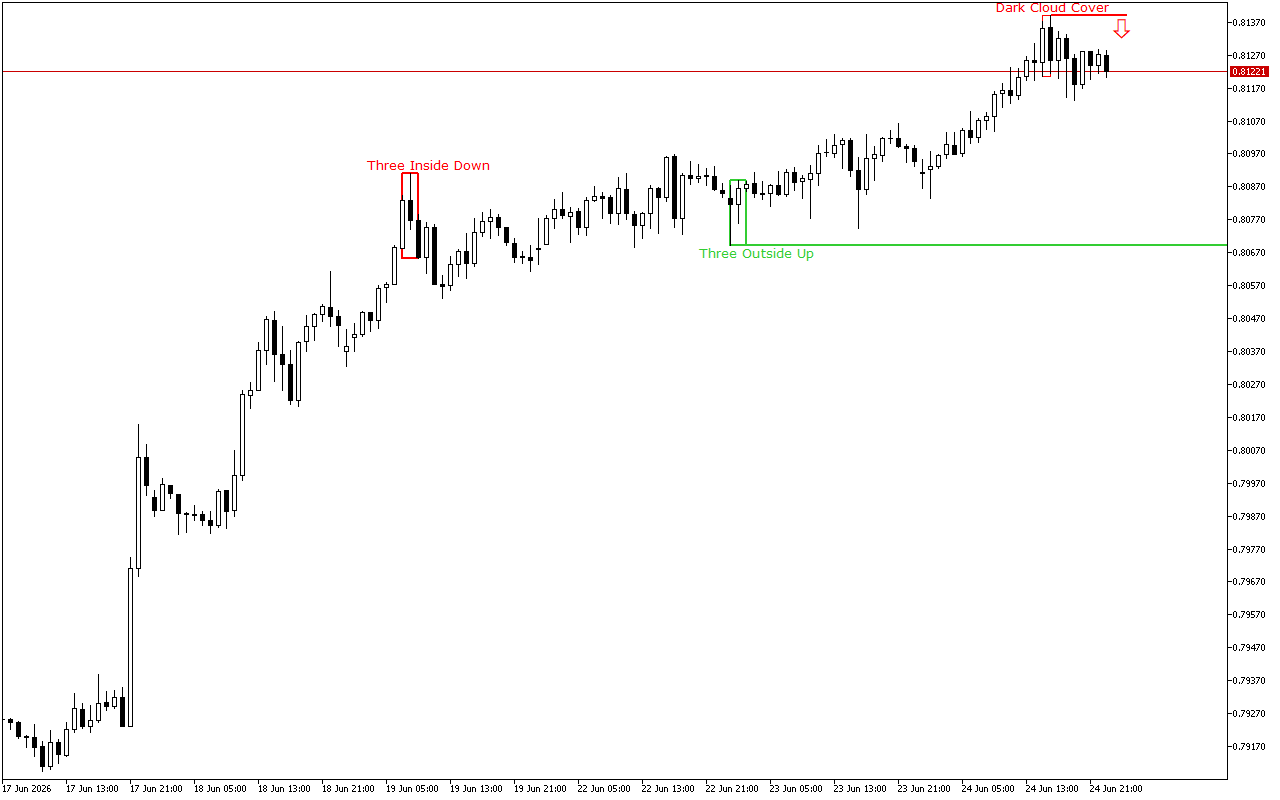
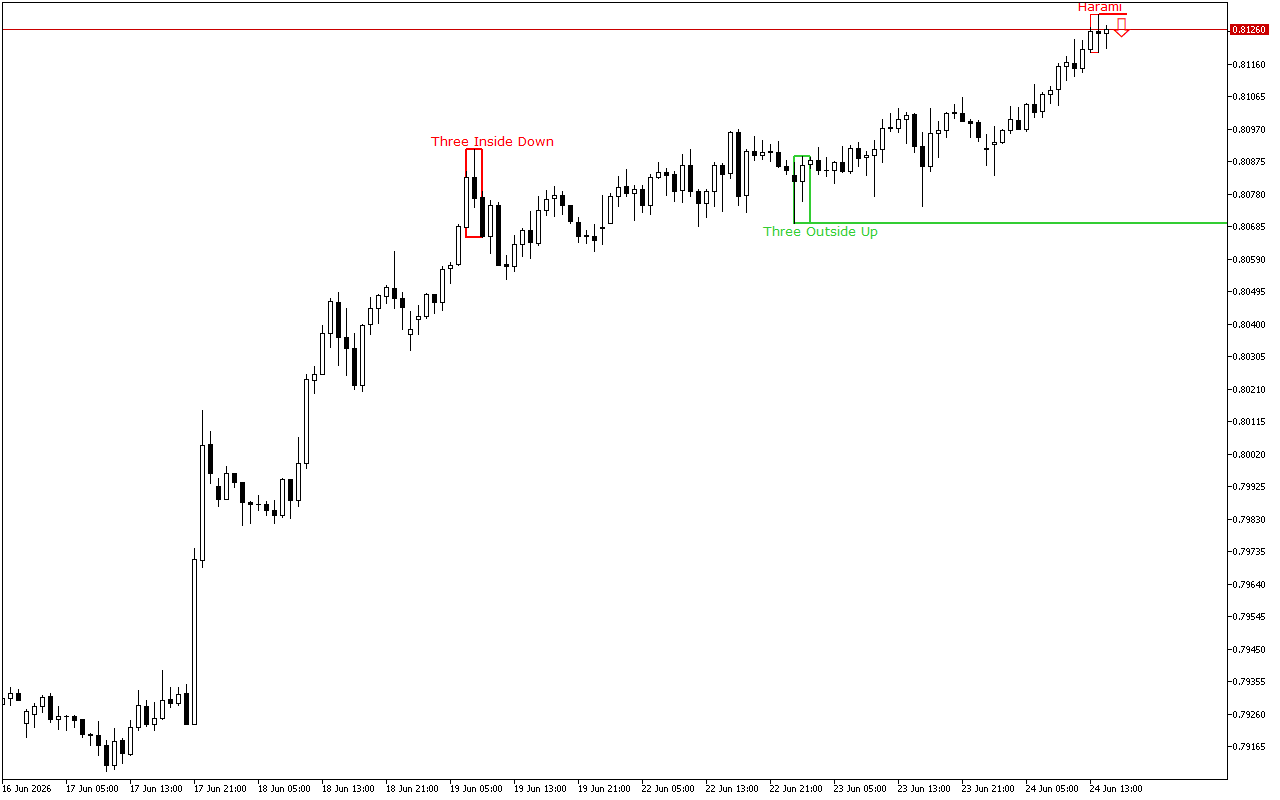
The nearest support is set at the 0.80693 mark.
This level was formed by the Three Outside Bars Up pattern. The pattern consists of three Japanese candlesticks: the first candlestick has a short black real body, the second candlestick has a long white real body and completely engulfs the first candlestick, and the third candlestick is also white, closing above the second candlestick.
The nearest resistance is set at the 0.81389 mark.
This level was formed by the Dark Cloud Cover pattern. The pattern consists of two candles: the first candle is long and white, and the second is black. The second one opens with a gap up and closes below the middle of the real body of the first candle.
Trading recommendations:
The latest signal prioritizes short positions intraday.
USDCHF H1: The Price Action Forecast for the Asian Session at 25.6.2026