During the previous trading session, USDCHF demonstrated downward dynamics. On a longer time-frame, the upward trend still prevails.
The support and resistance levels:
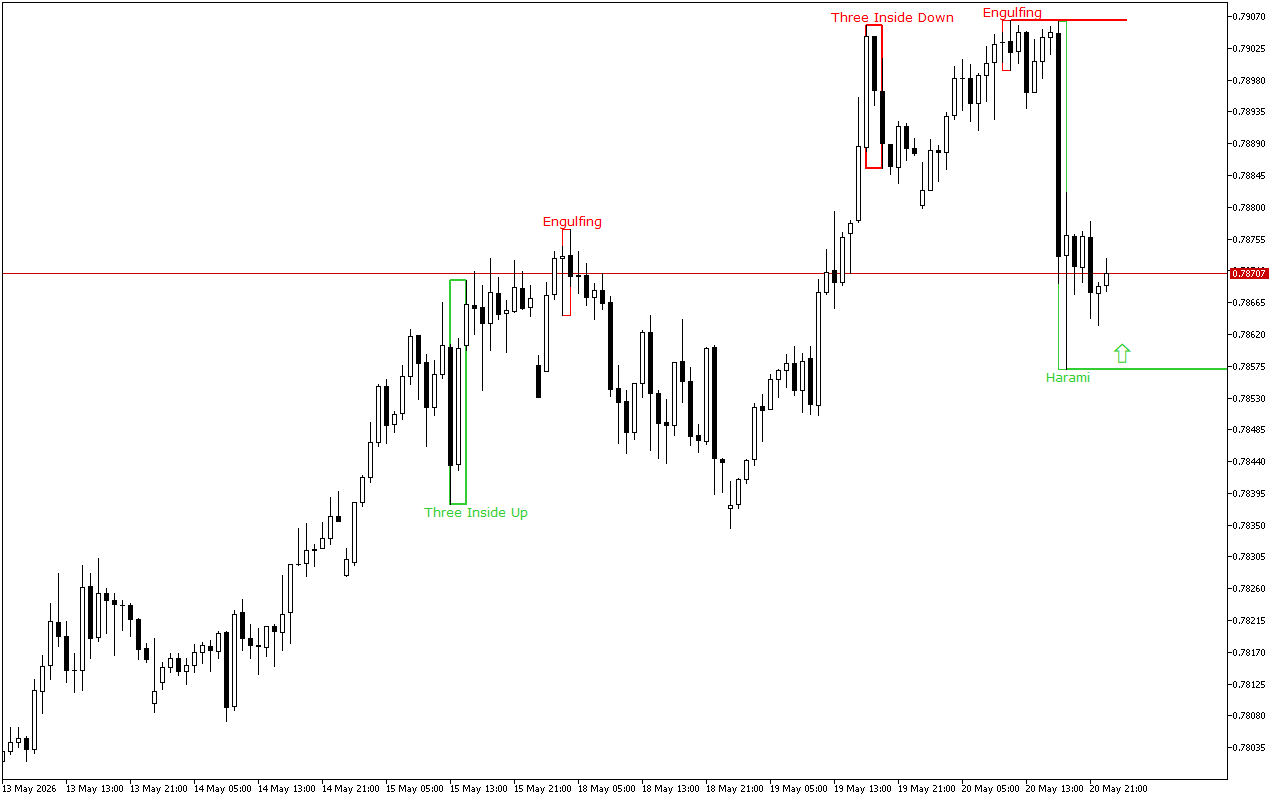
The current support level is in the area of the 0.78571 mark.
This level was formed by the Bullish Harami pattern. The pattern is represented with two Japanese candles, where the second one with a smaller real body is inside the body of the first one.
The current resistance level is at the 0.79064 mark.
The Bearish Engulfing pattern formed this level. It consists of two Japanese candles: the first candle is located inside the body of the second candle.
Trading recommendations:
The price movement dynamics for a longer period of time as well as the latest signals on the chart indicate the long positions opening intraday. The entry points can be considered from the nearest support levels.
USDCHF H1: The Price Action Forecast for the Asian Session at 21.5.2026