During the previous trading session, Natural Gas demonstrated downward dynamics. On a longer time-frame, the upward trend still prevails.
The support and resistance levels:
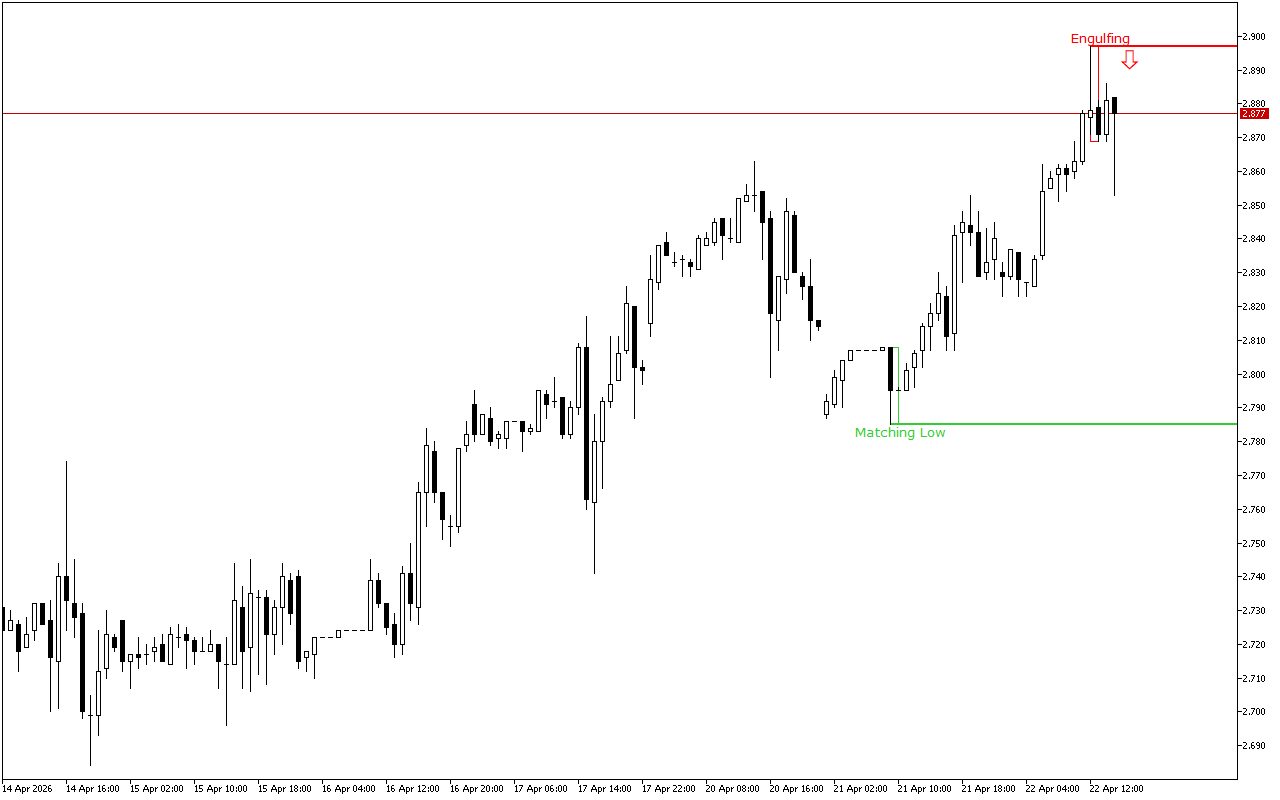
The nearest support level is at the price level of the 2.785.
This level was formed by the Bullish Matching Low pattern. This pattern is represented with two consecutive Japanese candles, which closing prices are low and are almost at the same level.
The nearest significant resistance level is at the 2.897 mark.
The Bearish Engulfing pattern formed this level. It consists of two Japanese candles: the first candle is located inside the body of the second candle.
Trading recommendations:
The latest signal prioritizes short positions intraday.
Natural Gas H1: The Price Action Forecast for the American Session on 22.4.2026