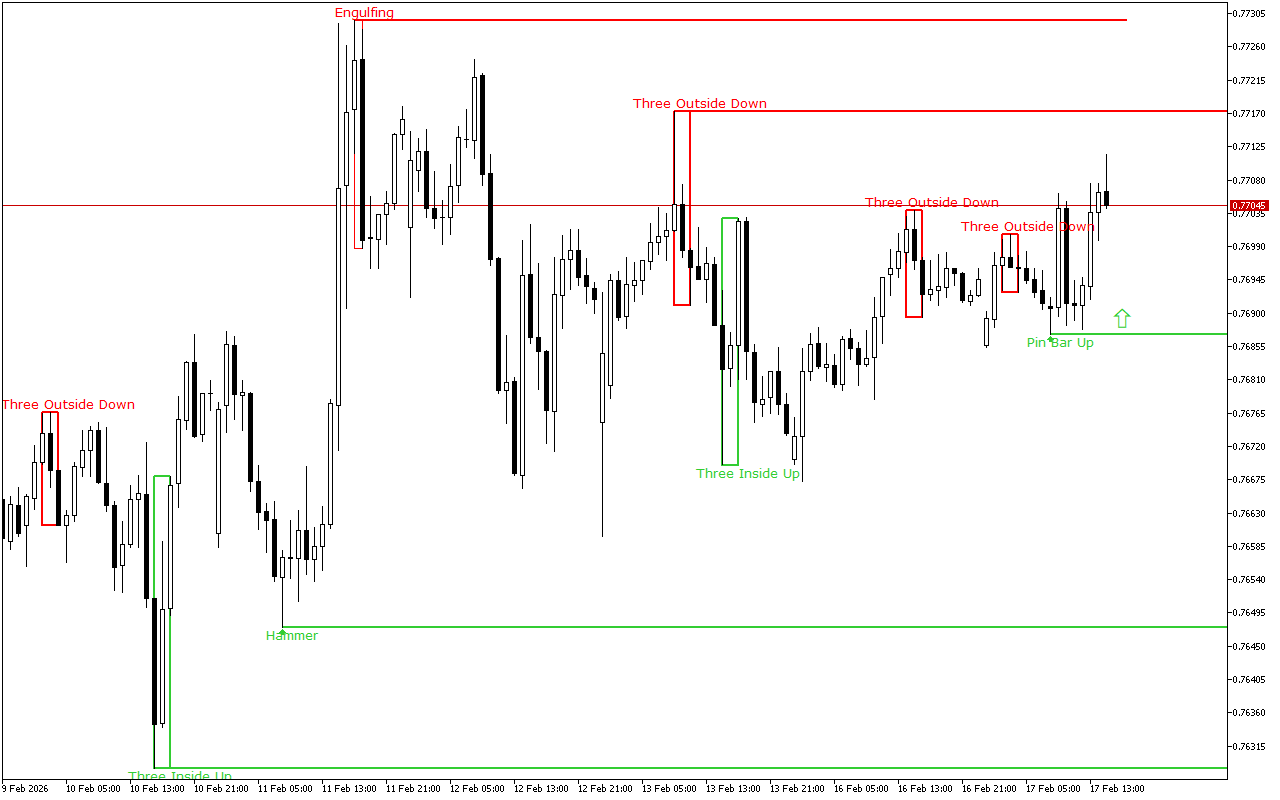
USDCHF closes the last trading session in the green zone, while the downward price movement vector prevails on the higher time-frame.
The support and resistance levels:
The nearest support is set at the 0.76871 mark.
This level is formed due to the appearance of the Pin Bar pattern. This pattern is represented with a candle with a small real body and a long lower shadow. This pattern is quite common at strong support levels.
The nearest resistance is set at the 0.77173 mark.
Trading recommendations:
The latest signal on the chart indicates the prevalence of the long positions. This signal is valid, until the other pattern is formed.
USDCHF H1: The Price Action Forecast for the American Session on 17.2.2026