During the previous trading session, the price of USDCHF decreased, moving in the main trend direction on the higher time-frame.
The support and resistance levels:
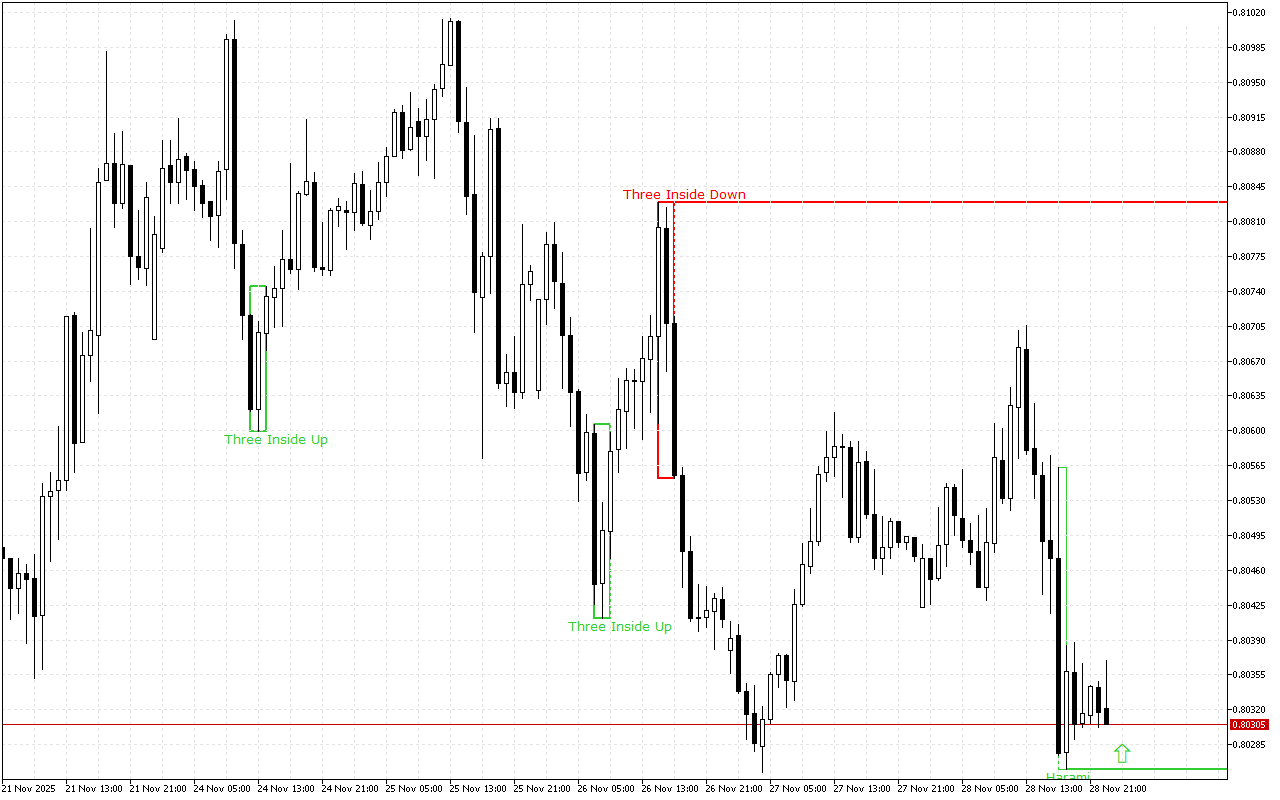
The current support level is in the area of the 0.8026 mark.
This level was formed by the Bullish Harami pattern. The pattern is represented with two Japanese candles, where the second one with a smaller real body is inside the body of the first one.
The current resistance level is at the 0.80829 mark.
This level was formed by the Three Inside Down pattern. This pattern consists of three Japanese candles: the first candle has a short black real body, the second candle also has a black real body and is completely inside the body of the first candle, and the third candle is also black and closes below the body of the second candle.
Trading recommendations:
The latest signal on the chart indicates the prevalence of the long positions. This signal is valid, until the other pattern is formed.
USDCHF H1: The Price Action Forecast for the Asian Session at 1.12.2025