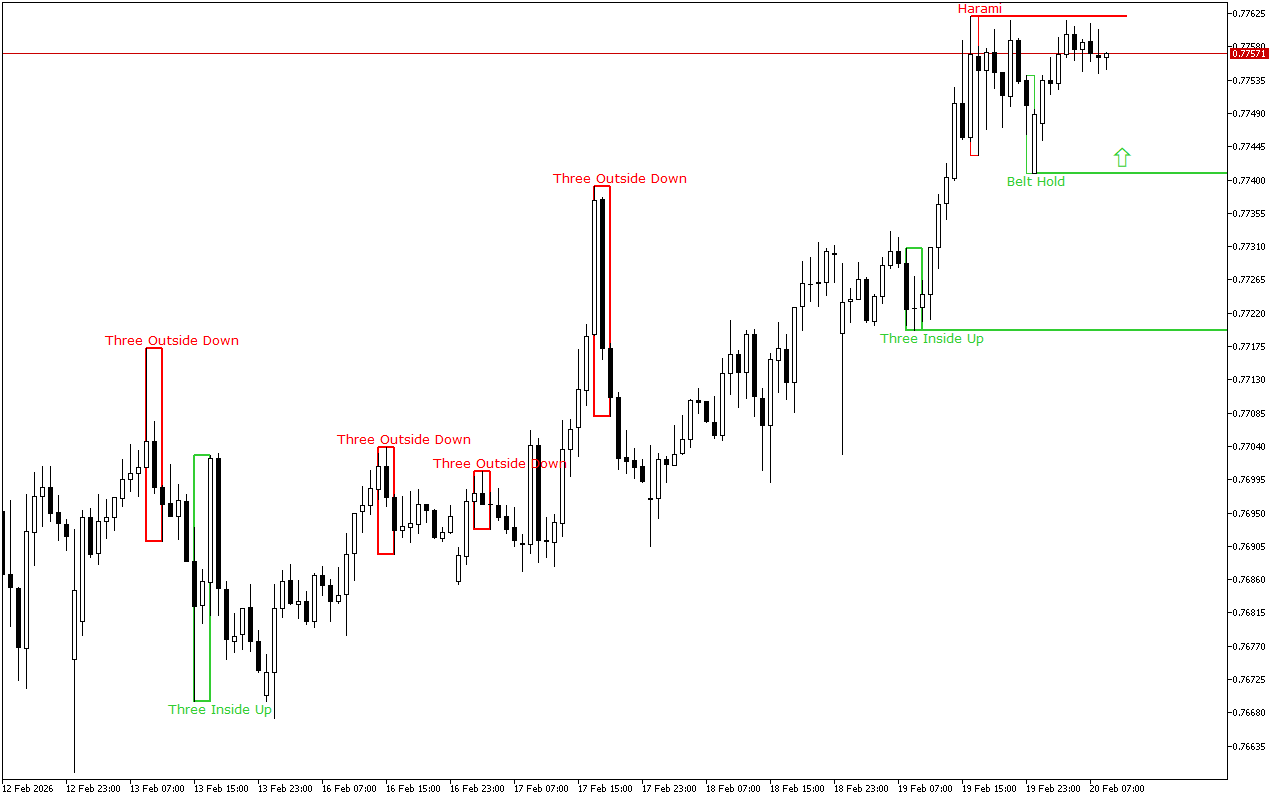
During the previous trading session, the positive dynamics of the USDCHF movement were seen. On a longer time-frame, the upward price movement vector also prevails.
The support and resistance levels:
The nearest support is set at the 0.77409 mark.
This level is formed by the Bullish Belt Hold pattern. It consists of one candle with a long white body. Its opening is at the day’s low. This pattern occurs after a downward movement and indicates a potential price growth.
The nearest resistance is set at the 0.77621 mark.
This level was formed by the Bearish Harami pattern, which is presented with two Japanese candlesticks where the second candlestick with a smaller real body is inside the body of the first one.
Trading recommendations:
The price movement dynamics for a longer period of time as well as the latest signals on the chart indicate the long positions opening intraday. The entry points can be considered from the nearest support levels.
USDCHF H1: The Price Action Forecast for the European Session on 20.2.2026