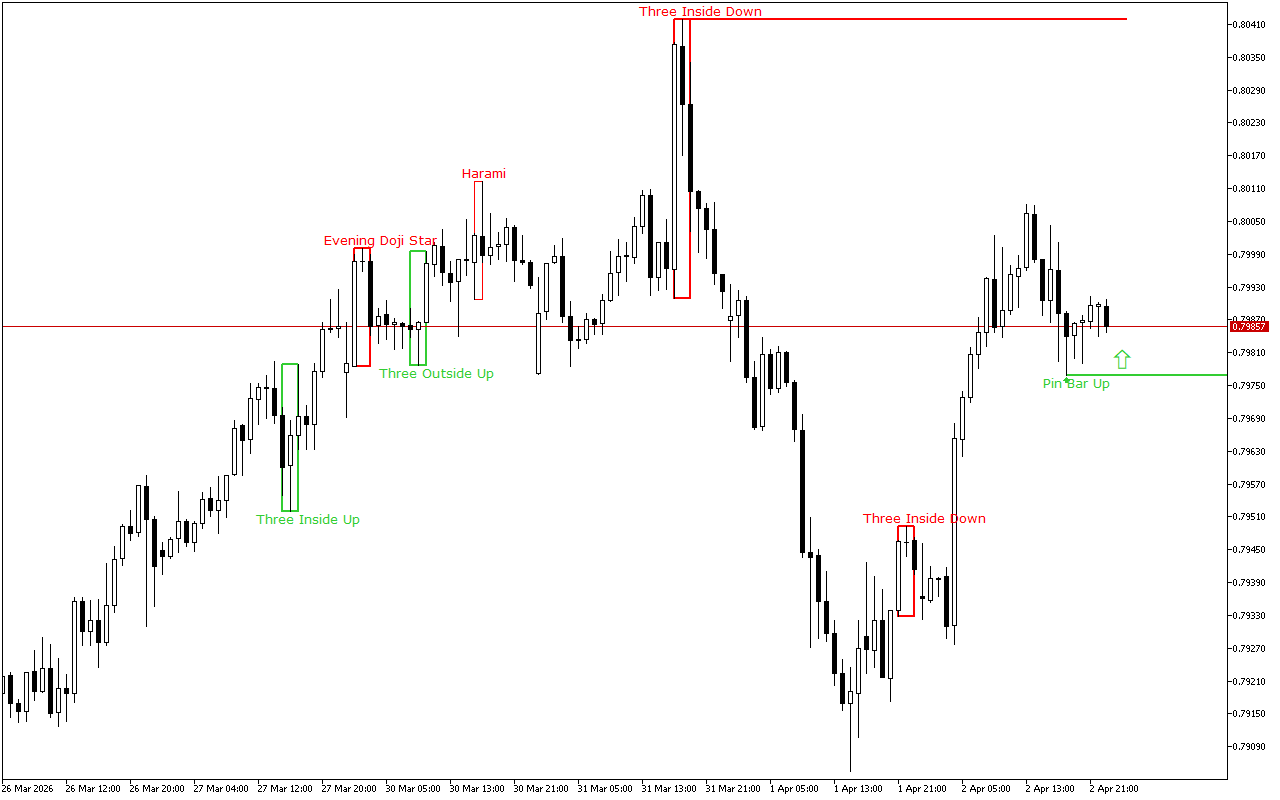
During the previous trading session, USDCHF demonstrated downward dynamics. On a longer time-frame, the upward trend still prevails.
The support and resistance levels:
The current support level is in the area of the 0.79768 mark.
This level is formed due to the appearance of the Pin Bar pattern. This pattern is represented with a candle with a small real body and a long lower shadow. This pattern is quite common at strong support levels.
The current resistance level is at the 0.80419 mark.
Trading recommendations:
On the higher time-frame, the upward price dynamics prevail. The last signal on the chart also indicates the upcoming growth. Against this background, it is worth prioritizing the buy signals during the day.
USDCHF H1: The Price Action Forecast for the Asian Session at 3.4.2026