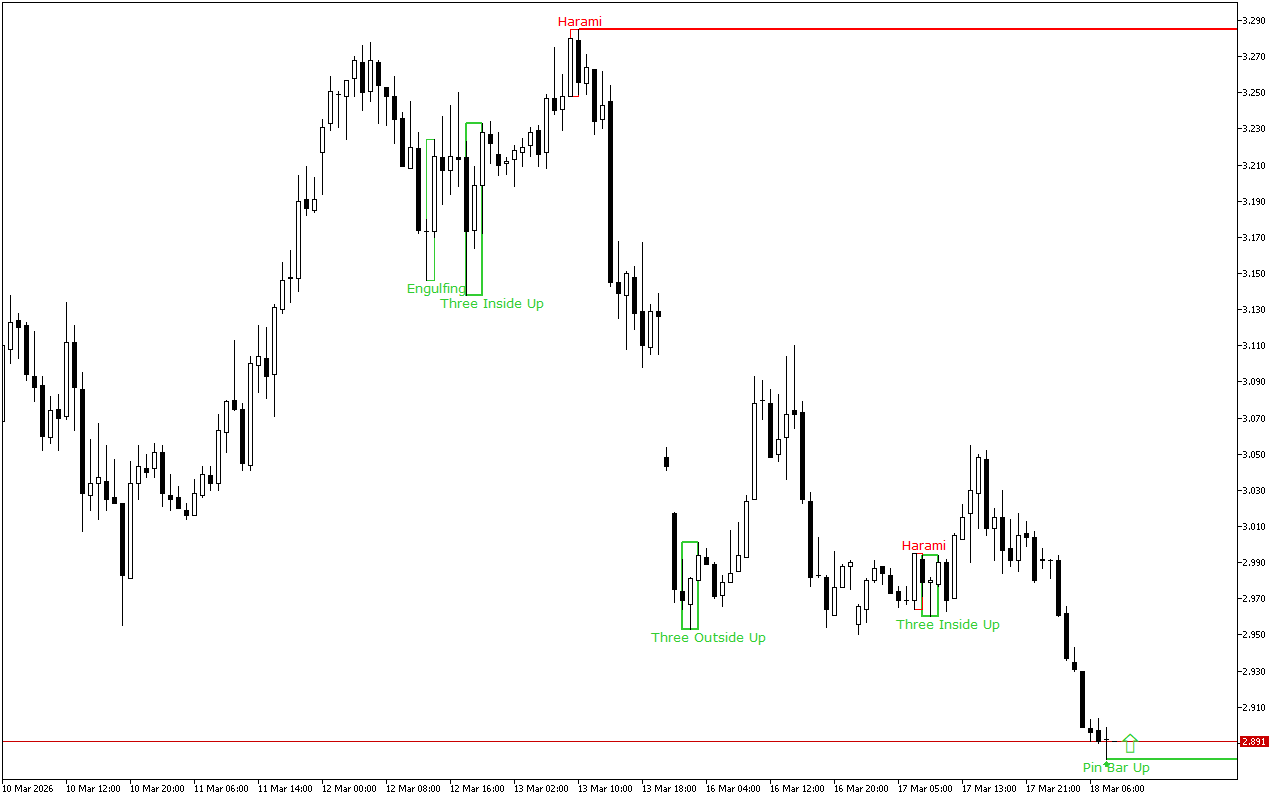
During the previous trading session, the price of Natural Gas decreased, moving in the main trend direction on the higher time-frame.
The support and resistance levels:
The nearest support level is at the price level of the 2.881.
This level is formed due to the appearance of the Pin Bar pattern. This pattern is represented with a candle with a small real body and a long lower shadow. This pattern is quite common at strong support levels.
The nearest significant resistance level is at the 3.285 mark.
Trading recommendations:
Despite the downward dynamics prevail on a higher time-frame, the long position should be prioritized intraday. The latest signal on the chart indicates the prevalence of the upward movement intraday.
Natural Gas H1: The Price Action Forecast for the European Session on 18.3.2026