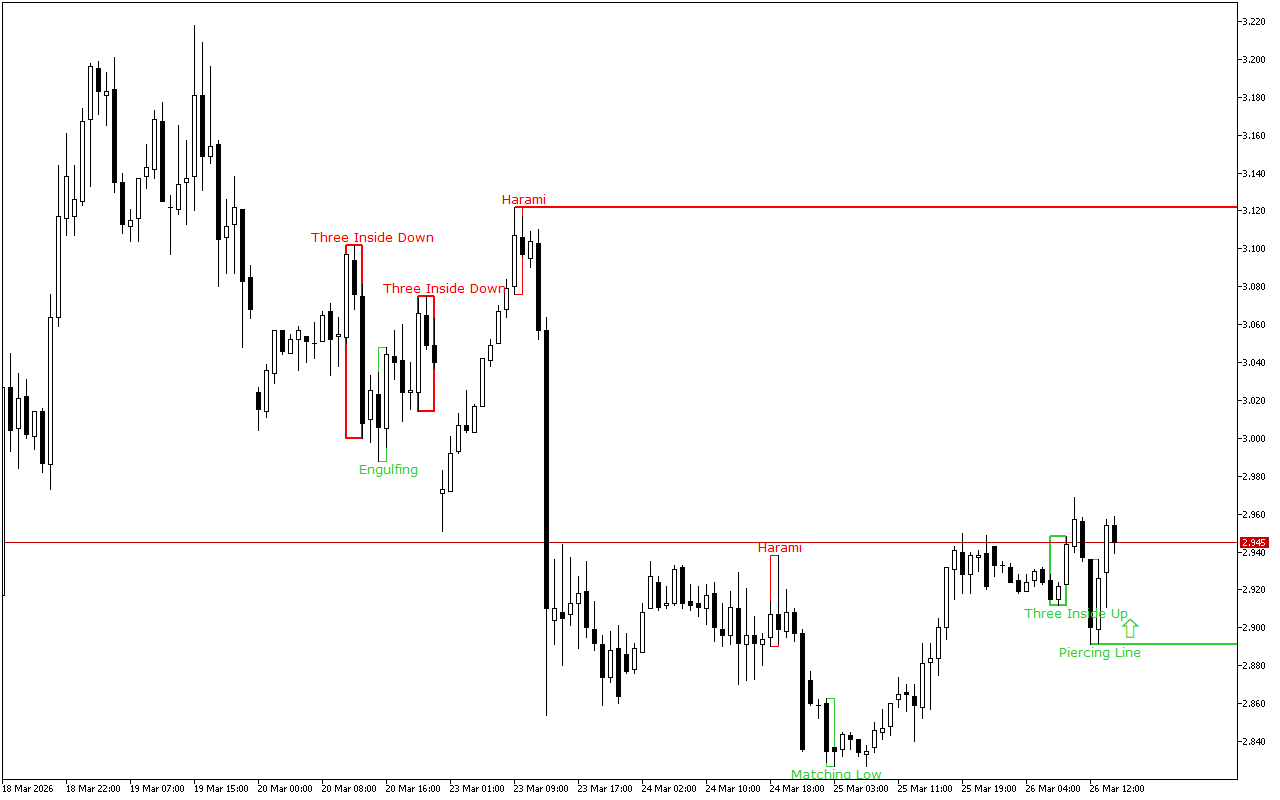
During the previous trading session, the price of Natural Gas decreased, moving in the main trend direction on the higher time-frame.
The support and resistance levels:
The nearest support is set at the 2.891 mark.
The Penetrating Line pattern formed this level. The pattern consists of two candles: the first one has a long black body, the second one has a white body. The second candle opens with a gap down and closes above the middle of the first candle’s body.
The nearest resistance is set at the 3.122 mark.
Trading recommendations:
The latest signal on the chart indicates the prevalence of the long positions. This signal is valid, until the other pattern is formed.
Natural Gas H1: The Price Action Forecast for the American Session on 26.3.2026