Natural Gas closes the last trading session in the green zone, while the downward price movement vector prevails on the higher time-frame.
The support and resistance levels:
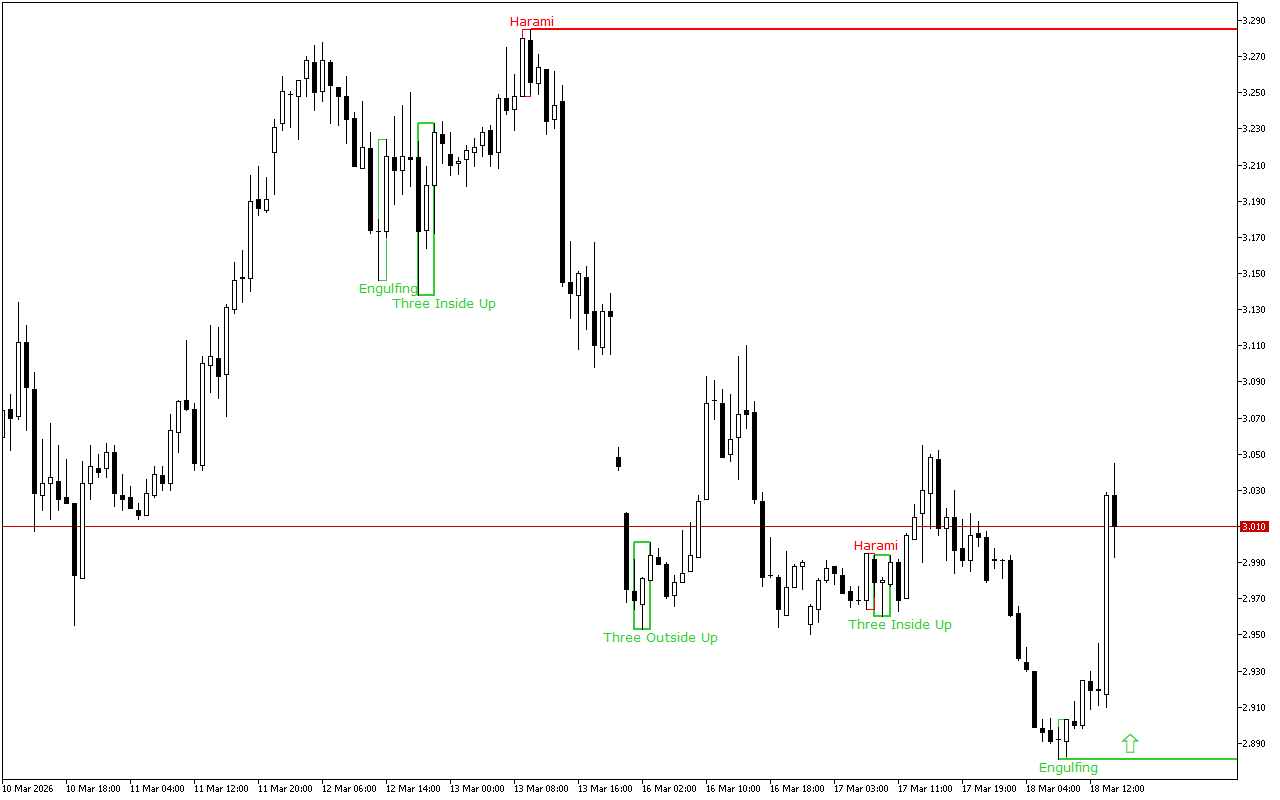
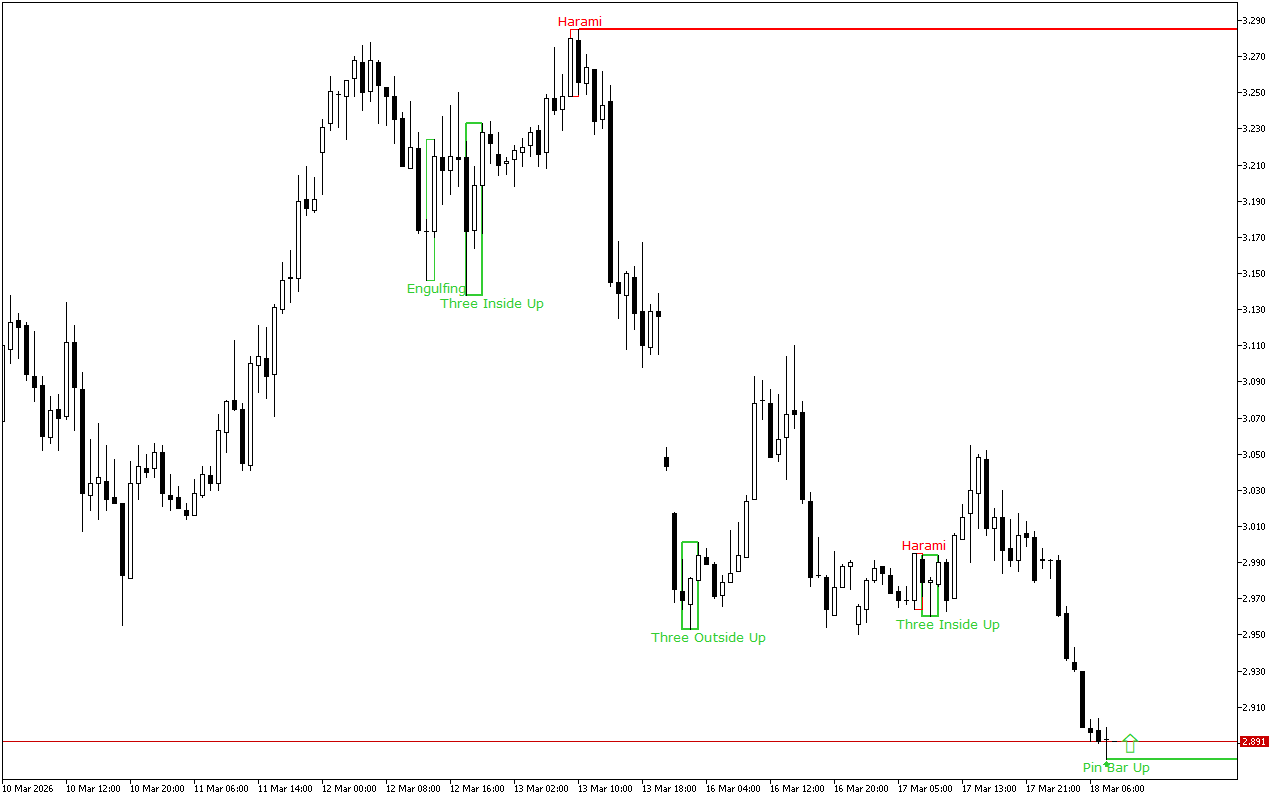
The nearest support is set at the 2.881 mark.
This level was formed by the Bullish Engulfing pattern. The pattern consists of two candles: the first one is inside the body of the second one, which is much larger. The second candle completely engulfs the first one.
The nearest resistance is set at the 3.285 mark.
Trading recommendations:
The latest signal on the chart indicates the prevalence of the long positions. This signal is valid, until the other pattern is formed.
Natural Gas H1: The Price Action Forecast for the American Session on 18.3.2026