During the previous trading session, Bit.Cash demonstrated downward dynamics. On a longer time-frame, the upward trend still prevails.
The support and resistance levels:
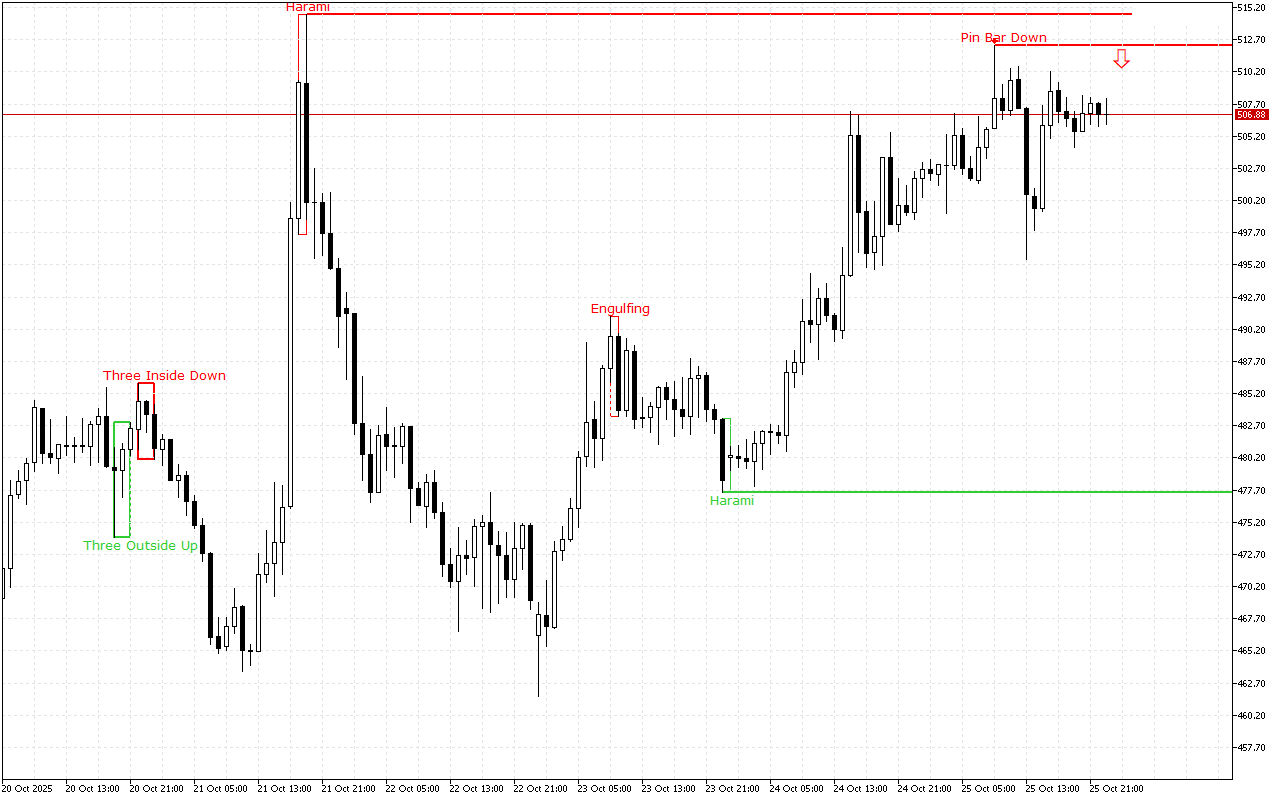
The nearest support is set at the 477.54 mark.
This level was formed by the Bullish Harami pattern. The pattern is represented with two Japanese candles, where the second one with a smaller real body is inside the body of the first one.
The nearest resistance is set at the 512.22 mark.
This level was formed by a Pin Bar pattern. This pattern is presented with a single Japanese candle with a small real body and a long upper shadow. This is one of the key patterns in the Price Action system.
Trading recommendations:
The latest signal prioritizes short positions intraday.
Bit.Cash H1: The Price Action Forecast for the Asian Session at 26.10.2025