Bit.Cash closes the last trading session in the green zone, while the downward price movement vector prevails on the higher time-frame.
The support and resistance levels:
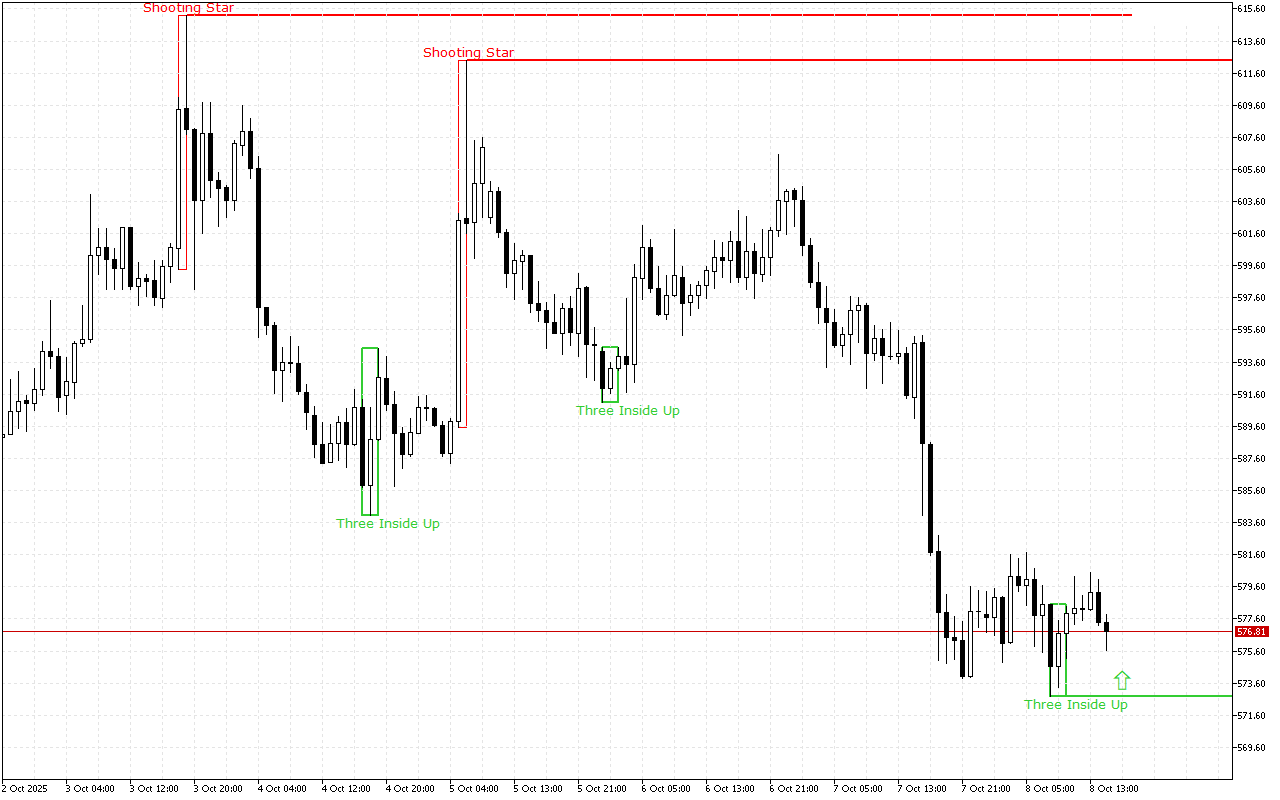
The nearest support level is at the price level of the 572.79.
This level was formed by the Three Inside Up pattern. This pattern consists of three Japanese candles: the first candle has a short white real body, the second candle has a white real body and is completely inside the body of the first candle, and the third candle is also white and closes above the body of the second candle.
The nearest significant resistance level is at the 612.4 mark.
The level was formed by the Shooting Star pattern. This pattern is a single candlestick which is composed of a small real body and a long upper shadow. This pattern is usually called “Pin Bar” by traders.
Trading recommendations:
The latest signal on the chart indicates the prevalence of the long positions. This signal is valid, until the other pattern is formed.
Bit.Cash H1: The Price Action Forecast for the American Session on 8.10.2025