During the previous trading session, the price of Natural Gas decreased, moving in the main trend direction on the higher time-frame.
The support and resistance levels:
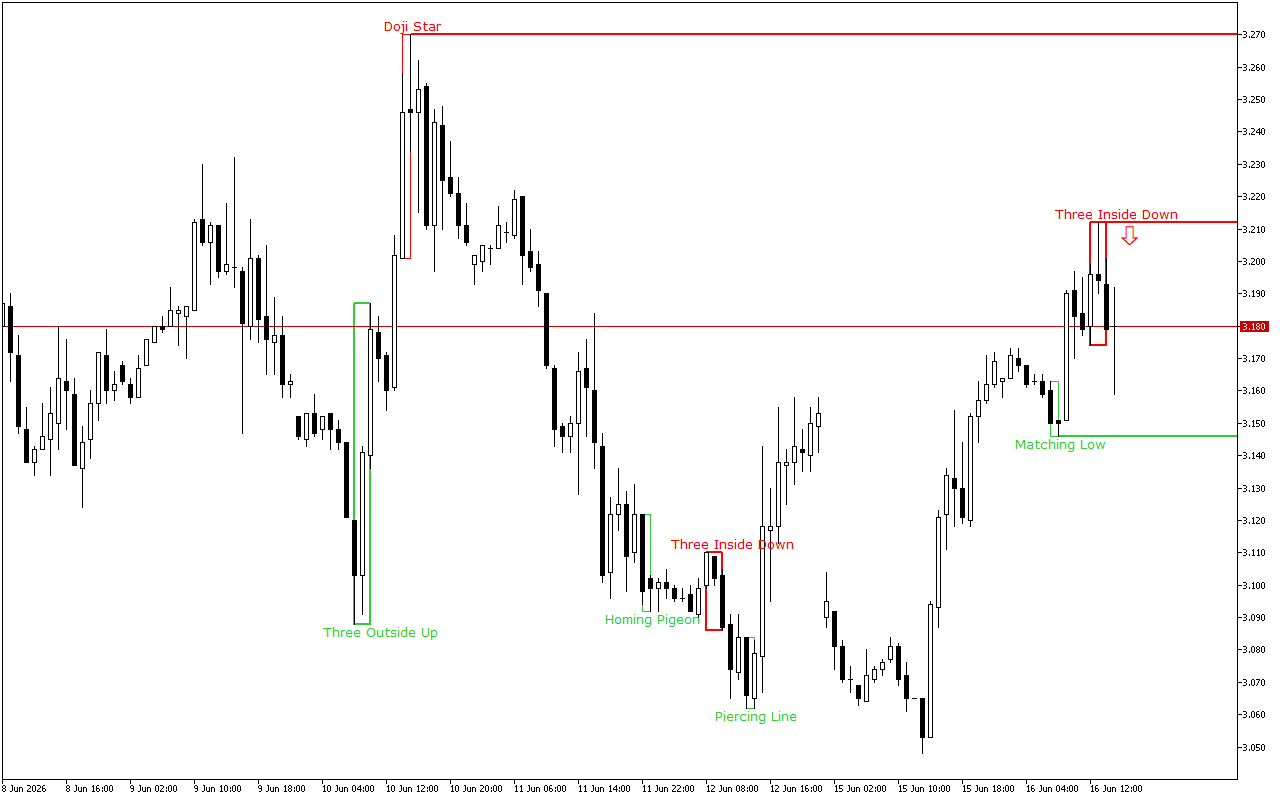
The nearest support level is at the price level of the 3.146.
This level was formed by the Bullish Matching Low pattern. This pattern is represented with two consecutive Japanese candles, which closing prices are low and are almost at the same level.
The nearest significant resistance level is at the 3.212 mark.
This level was formed by the Three Inside Down pattern. This pattern consists of three Japanese candles: the first candle has a short black real body, the second candle also has a black real body and is completely inside the body of the first candle, and the third candle is also black and closes below the body of the second candle.
Trading recommendations:
During the day, it is worth considering the possibilities for opening short positions. This is indicated by both: the dynamics of price movement over a longer distance and the latest formed pattern.
Natural Gas H1: The Price Action Forecast for the American Session on 16.6.2026