Natural Gas closes the last trading session in the green zone, while the downward price movement vector prevails on the higher time-frame.
The support and resistance levels:
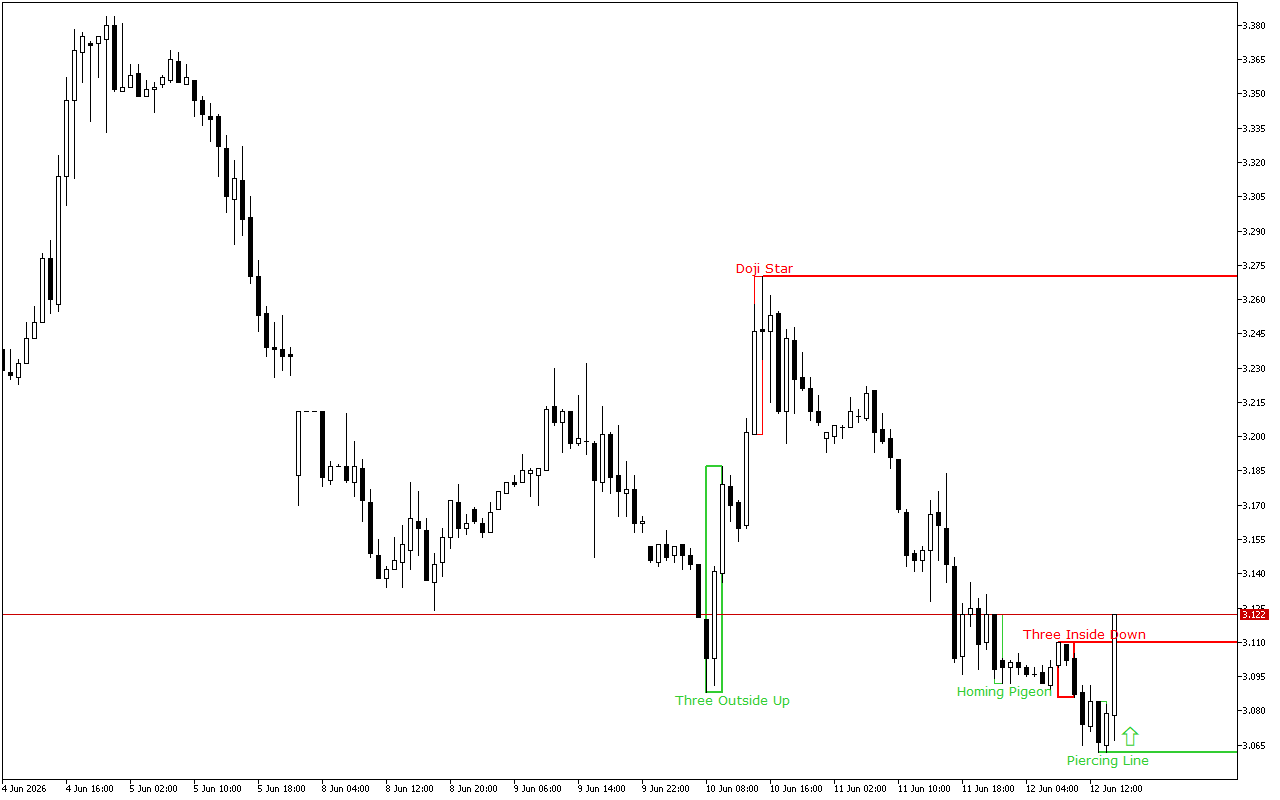
The support level is near the 3.062 mark.
The Penetrating Line pattern formed this level. The pattern consists of two candles: the first one has a long black body, the second one has a white body. The second candle opens with a gap down and closes above the middle of the first candle’s body.
The resistance level is near the 3.11 mark.
This level was formed by the Three Inside Down pattern. This pattern consists of three Japanese candles: the first candle has a short black real body, the second candle also has a black real body and is completely inside the body of the first candle, and the third candle is also black and closes below the body of the second candle.
Trading recommendations:
Despite the downward dynamics prevail on a higher time-frame, the long position should be prioritized intraday. The latest signal on the chart indicates the prevalence of the upward movement intraday.
Natural Gas H1: The Price Action Forecast for the American Session on 12.6.2026