During the previous trading session, the price of USDCHF decreased, moving in the main trend direction on the higher time-frame.
The support and resistance levels:
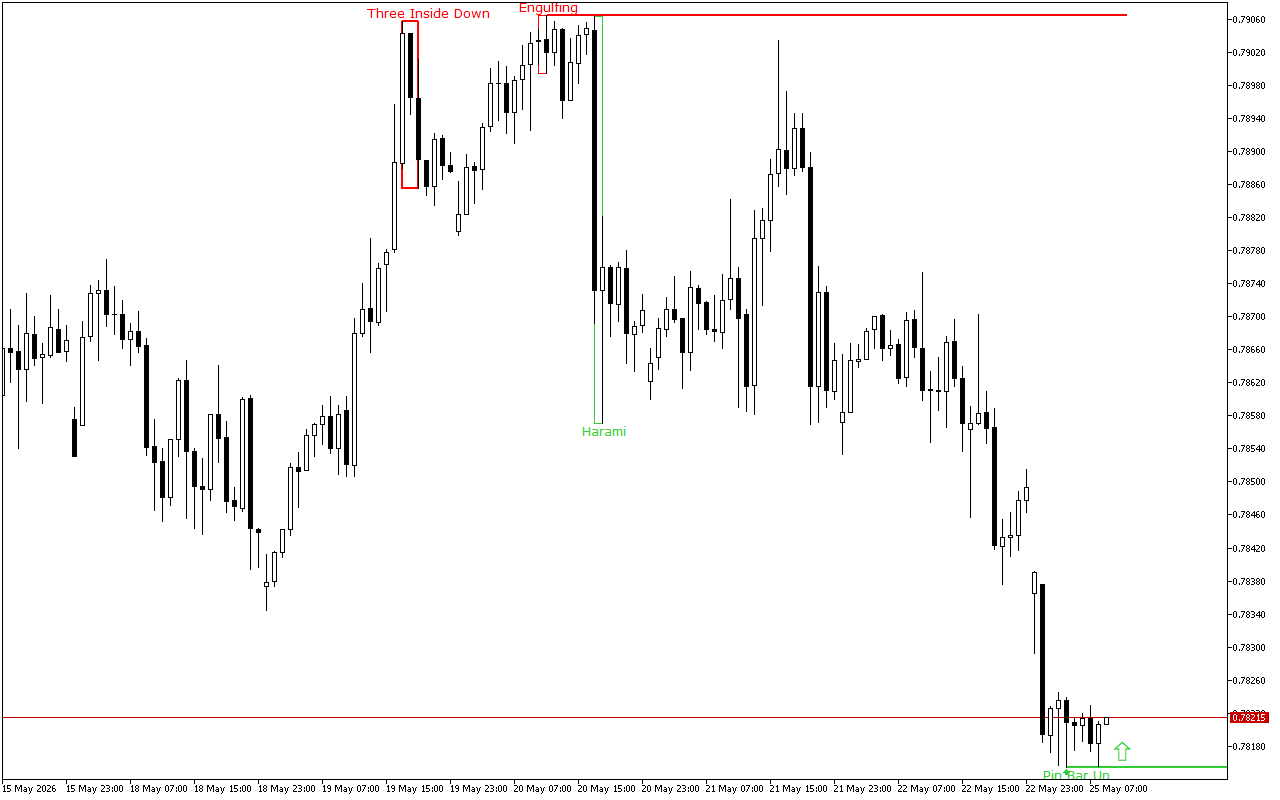
The nearest support is set at the 0.78154 mark.
This level is formed due to the appearance of the Pin Bar pattern. This pattern is represented with a candle with a small real body and a long lower shadow. This pattern is quite common at strong support levels.
The nearest resistance is set at the 0.79064 mark.
The Bearish Engulfing pattern formed this level. It consists of two Japanese candles: the first candle is located inside the body of the second candle.
Trading recommendations:
Despite the downward dynamics prevail on a higher time-frame, the long position should be prioritized intraday. The latest signal on the chart indicates the prevalence of the upward movement intraday.
USDCHF H1: The Price Action Forecast for the European Session on 25.5.2026