During the previous trading session, the positive dynamics of the USDCHF movement were seen. On a longer time-frame, the upward price movement vector also prevails.
The support and resistance levels:
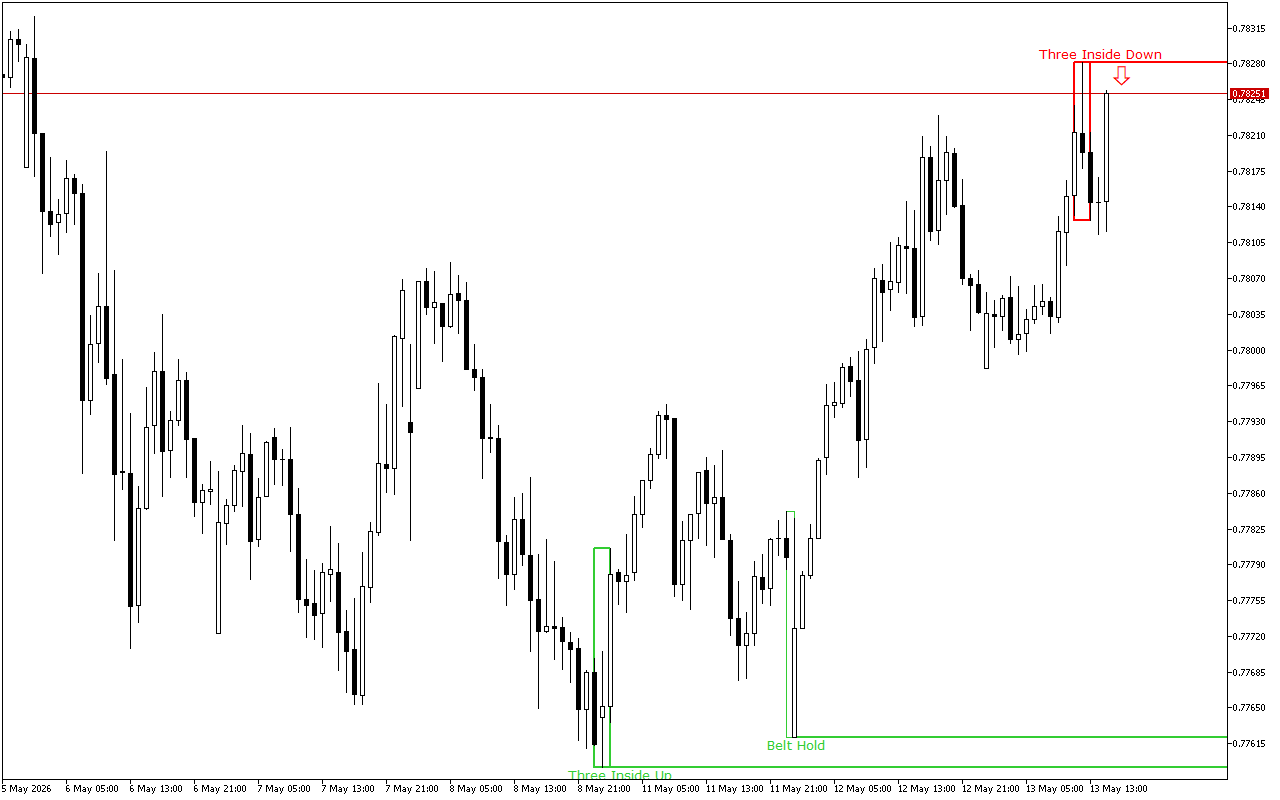
The support level is near the 0.77621 mark.
This level is formed by the Bullish Belt Hold pattern. It consists of one candle with a long white body. Its opening is at the day’s low. This pattern occurs after a downward movement and indicates a potential price growth.
The resistance level is near the 0.78281 mark.
This level was formed by the Three Inside Down pattern. This pattern consists of three Japanese candles: the first candle has a short black real body, the second candle also has a black real body and is completely inside the body of the first candle, and the third candle is also black and closes below the body of the second candle.
Trading recommendations:
The upward dynamics prevail on a longer time period, but the short positions should be prioritized during the day because the latest signal suggests a dominant downward movement.
USDCHF H1: The Price Action Forecast for the American Session on 13.5.2026