During the previous trading session, the positive dynamics of the USDCHF movement were seen. On a longer time-frame, the upward price movement vector also prevails.
The support and resistance levels:
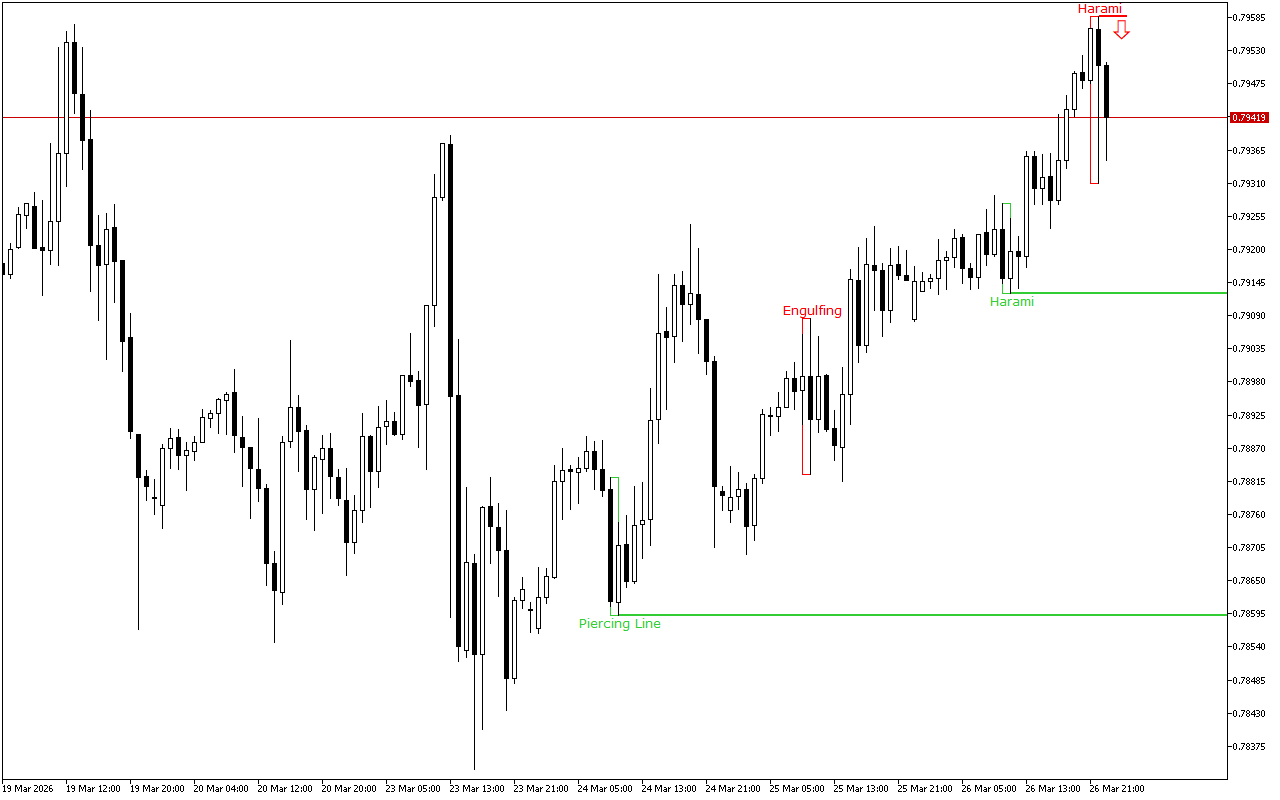
The support level is near the 0.79127 mark.
This level was formed by the Bullish Harami pattern. The pattern is represented with two Japanese candles, where the second one with a smaller real body is inside the body of the first one.
The resistance level is near the 0.79586 mark.
This level was formed by the Bearish Harami pattern, which is presented with two Japanese candlesticks where the second candlestick with a smaller real body is inside the body of the first one.
Trading recommendations:
The latest signal prioritizes short positions intraday.
USDCHF H1: The Price Action Forecast for the Asian Session at 27.3.2026