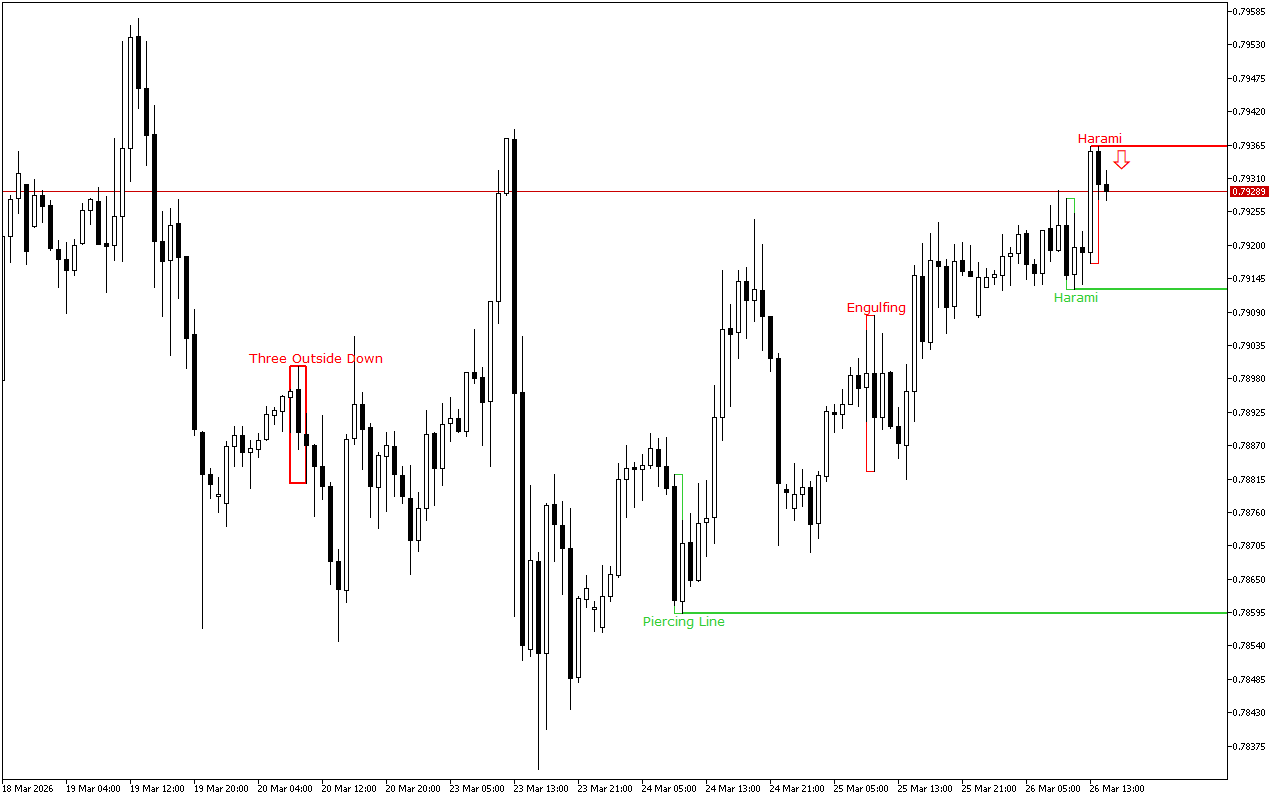
During the previous trading session, USDCHF demonstrated downward dynamics. On a longer time-frame, the upward trend still prevails.
The support and resistance levels:
The support level is near the 0.79127 mark.
This level was formed by the Bullish Harami pattern. The pattern is represented with two Japanese candles, where the second one with a smaller real body is inside the body of the first one.
The resistance level is near the 0.79363 mark.
This level was formed by the Bearish Harami pattern, which is presented with two Japanese candlesticks where the second candlestick with a smaller real body is inside the body of the first one.
Trading recommendations:
The upward dynamics prevail on a longer time period, but the short positions should be prioritized during the day because the latest signal suggests a dominant downward movement.
USDCHF H1: The Price Action Forecast for the American Session on 26.3.2026