During the previous trading session, the price of Natural Gas decreased, moving in the main trend direction on the higher time-frame.
The support and resistance levels:
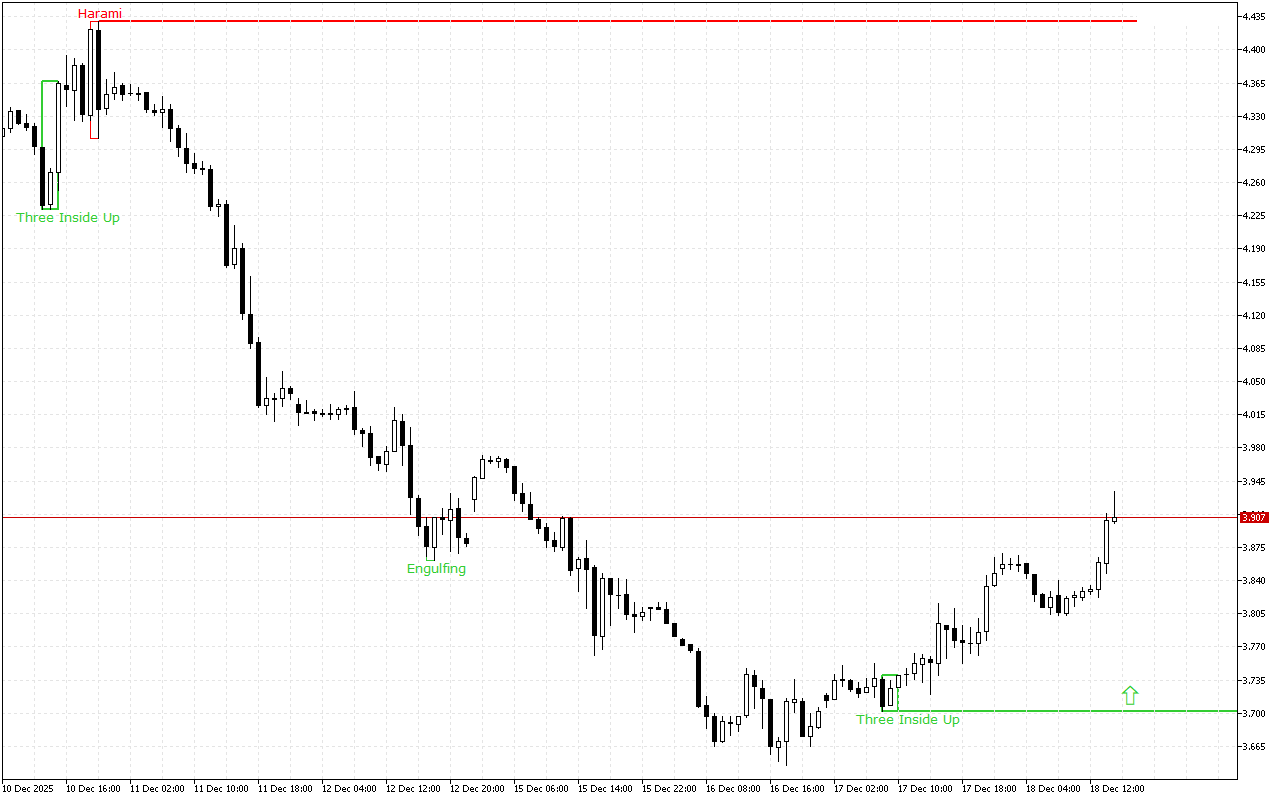
The current support level is in the area of the 3.702 mark.
This level was formed by the Three Inside Up pattern. This pattern consists of three Japanese candles: the first candle has a short white real body, the second candle has a white real body and is completely inside the body of the first candle, and the third candle is also white and closes above the body of the second candle.
The current resistance level is at the 4.43 mark.
This level was formed by the Bearish Harami pattern, which is presented with two Japanese candlesticks where the second candlestick with a smaller real body is inside the body of the first one.
Trading recommendations:
Despite the downward dynamics prevail on a higher time-frame, the long position should be prioritized intraday. The latest signal on the chart indicates the prevalence of the upward movement intraday.
Natural Gas H1: The Price Action Forecast for the American Session on 18.12.2025