During the previous trading session, the positive dynamics of the USDCHF movement were seen. On a longer time-frame, the upward price movement vector also prevails.
The support and resistance levels:
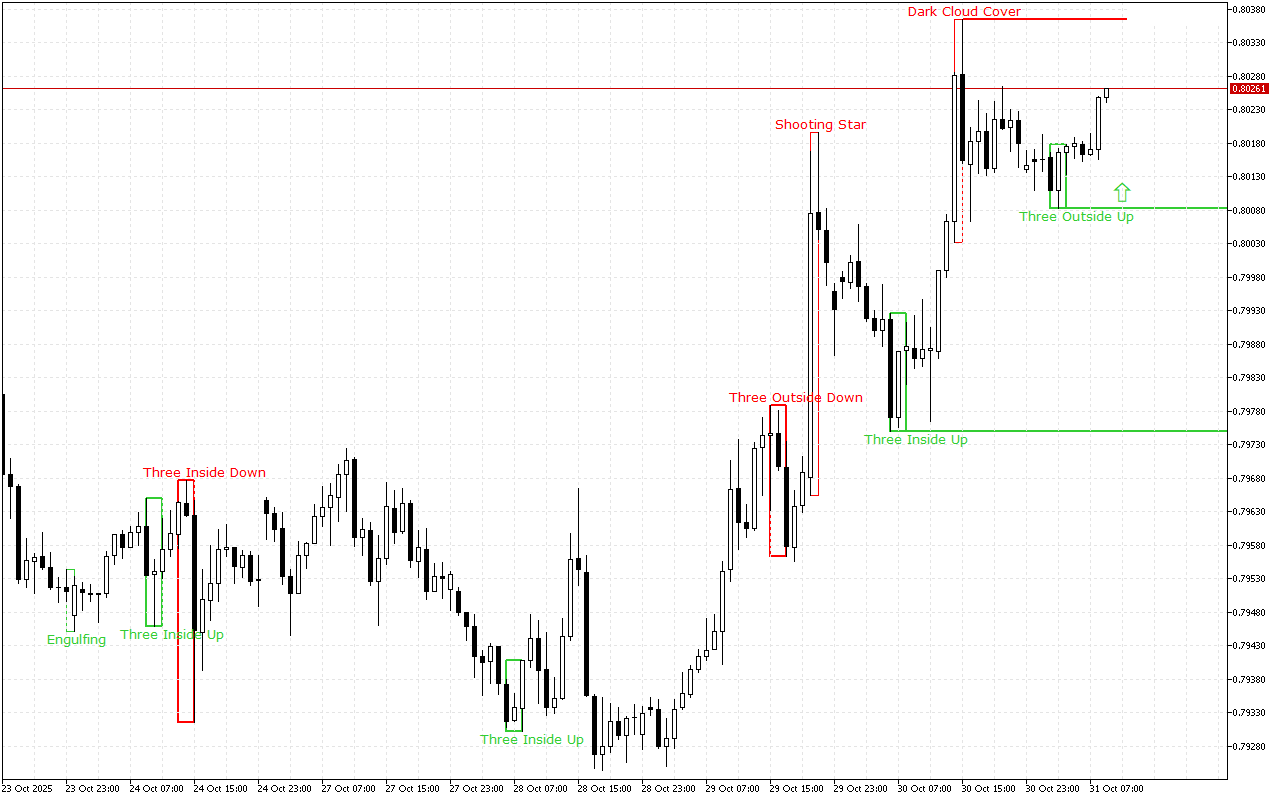
The support level is near the 0.80083 mark.
This level was formed by the Three Outside Bars Up pattern. The pattern consists of three Japanese candlesticks: the first candlestick has a short black real body, the second candlestick has a long white real body and completely engulfs the first candlestick, and the third candlestick is also white, closing above the second candlestick.
The resistance level is near the 0.80364 mark.
This level was formed by the Dark Cloud Cover pattern. The pattern consists of two candles: the first candle is long and white, and the second is black. The second one opens with a gap up and closes below the middle of the real body of the first candle.
Trading recommendations:
The price movement dynamics for a longer period of time as well as the latest signals on the chart indicate the long positions opening intraday. The entry points can be considered from the nearest support levels.
USDCHF H1: The Price Action Forecast for the European Session on 31.10.2025