During the previous trading session, USDCHF demonstrated downward dynamics. On a longer time-frame, the upward trend still prevails.
The support and resistance levels:
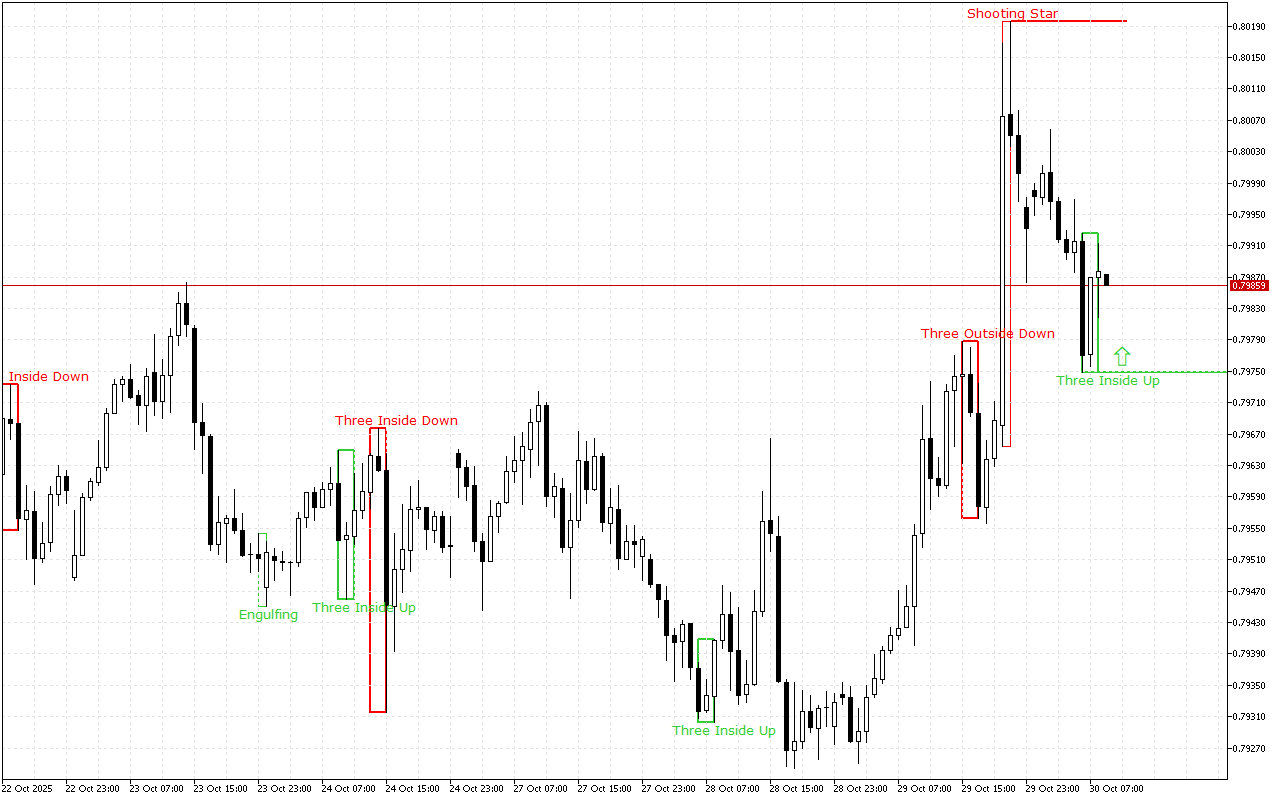
The support level is near the 0.79749 mark.
This level was formed by the Three Inside Up pattern. This pattern consists of three Japanese candles: the first candle has a short white real body, the second candle has a white real body and is completely inside the body of the first candle, and the third candle is also white and closes above the body of the second candle.
The resistance level is near the 0.80196 mark.
The level was formed by the Shooting Star pattern. This pattern is a single candlestick which is composed of a small real body and a long upper shadow. This pattern is usually called “Pin Bar” by traders.
Trading recommendations:
On the higher time-frame, the upward price dynamics prevail. The last signal on the chart also indicates the upcoming growth. Against this background, it is worth prioritizing the buy signals during the day.
USDCHF H1: The Price Action Forecast for the European Session on 30.10.2025