During the previous trading session, the price of Bit.Cash decreased, moving in the main trend direction on the higher time-frame.
The support and resistance levels:
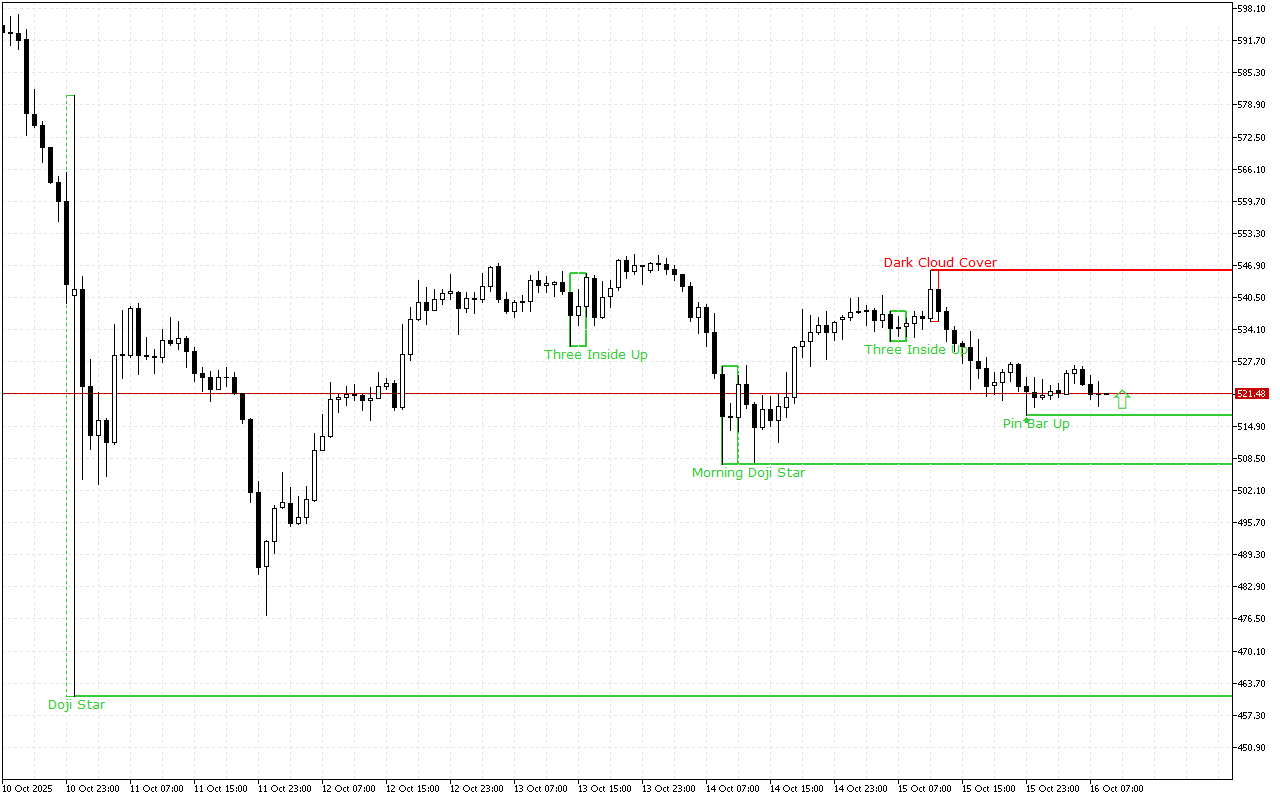
The nearest support level is at the price level of the 517.05.
This level is formed due to the appearance of the Pin Bar pattern. This pattern is represented with a candle with a small real body and a long lower shadow. This pattern is quite common at strong support levels.
The nearest significant resistance level is at the 545.87 mark.
This level was formed by the Dark Cloud Cover pattern. The pattern consists of two candles: the first candle is long and white, and the second is black. The second one opens with a gap up and closes below the middle of the real body of the first candle.
Trading recommendations:
The latest signal on the chart indicates the prevalence of the long positions. This signal is valid, until the other pattern is formed.
Bit.Cash H1: The Price Action Forecast for the European Session on 16.10.2025